The Grammar of Graphics was not intended to be a real software programme with which you can make any visualisation imaginable. But the abstract concepts introduced in the book proved to be a good foundation for implementing the Grammar of Graphics and its concepts into existing or new software programmes.
ggplot2
ggplot2 is a package for the R programming language that implements the Grammar of Graphics (the “gg” in the package’s names stands for “grammar of graphics”). The package was initially created by statistician and software developer Hadley Wickham in 2005. Version 1.0 of the package was released in 2014, and since then ggplot2 has been replacing the built-in graphics capabilities of R for many R users.
ggplot(mtcars.col, aes(x = disp, y = hp, color = as.factor(cyl))) +
  geom_point(size = 3) +
  scale_color_discrete(name = "Cylinders") +
  ylab("Horsepower") +
  xlab("Engine displacement (cubic inch)") +
  ggtitle("Bigger engines have more power") +
  theme_minimal() +
  theme(legend.position = "top")
ggplot2 integrates nicely with a set of related R packages to work with data in R called the tidyverse.
Vega-Lite
Vega was designed as a language to store and exchange descriptions of visualisations. These descriptions are called specifications, and are using the JavaScript Object Notation (JSON).
JSON is a widely used file format for exchanging data, and as a result, Vega has been adopted by many software programmes to store specifications of charts internally. Vega is also used to exchange chart specifications between different software programmes.
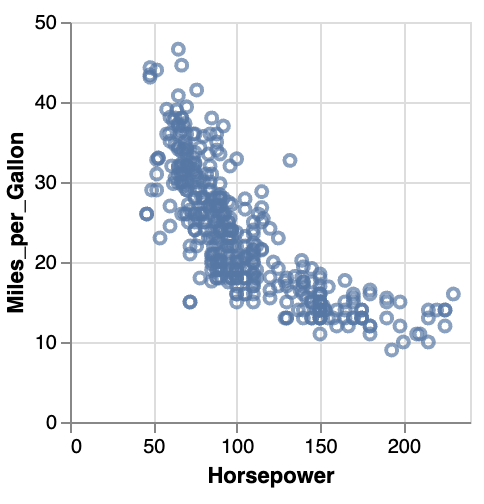
Vega has a smaller sister called Vega-Lite. With Vega-Lite it is easier to create visualisation specifications, but it is not as flexible as Vega is. But just like with Vega, you can also describe the interactive behaviour of a visualisation.
{
  "$schema": "https://vega.github.io/schema/vega-lite/v5.json",
  "description": "A scatterplot showing horsepower and miles per gallons for various cars.",
  "data": {"url": "data/cars.json"},
  "mark": "point",
  "encoding": {
    "x": {"field": "Horsepower", "type": "quantitative"},
    "y": {"field": "Miles_per_Gallon", "type": "quantitative"}
  }
}
Source: vega.github.io/vega-lite/examples
Observable Plot
Observable Plot is a free and open-source JavaScript visualisation library based on the principles of the Grammar of Graphics. Plot is developed by Observable, a platform for programmable notebooks based on JavaScript, with a heavy focus on data and data visualisation.
A scatter plot of male (orange) and female (blue) athlete heights and weights made with Observable Plot. Source: observablehq.com/@observablehq/plot
Tableau
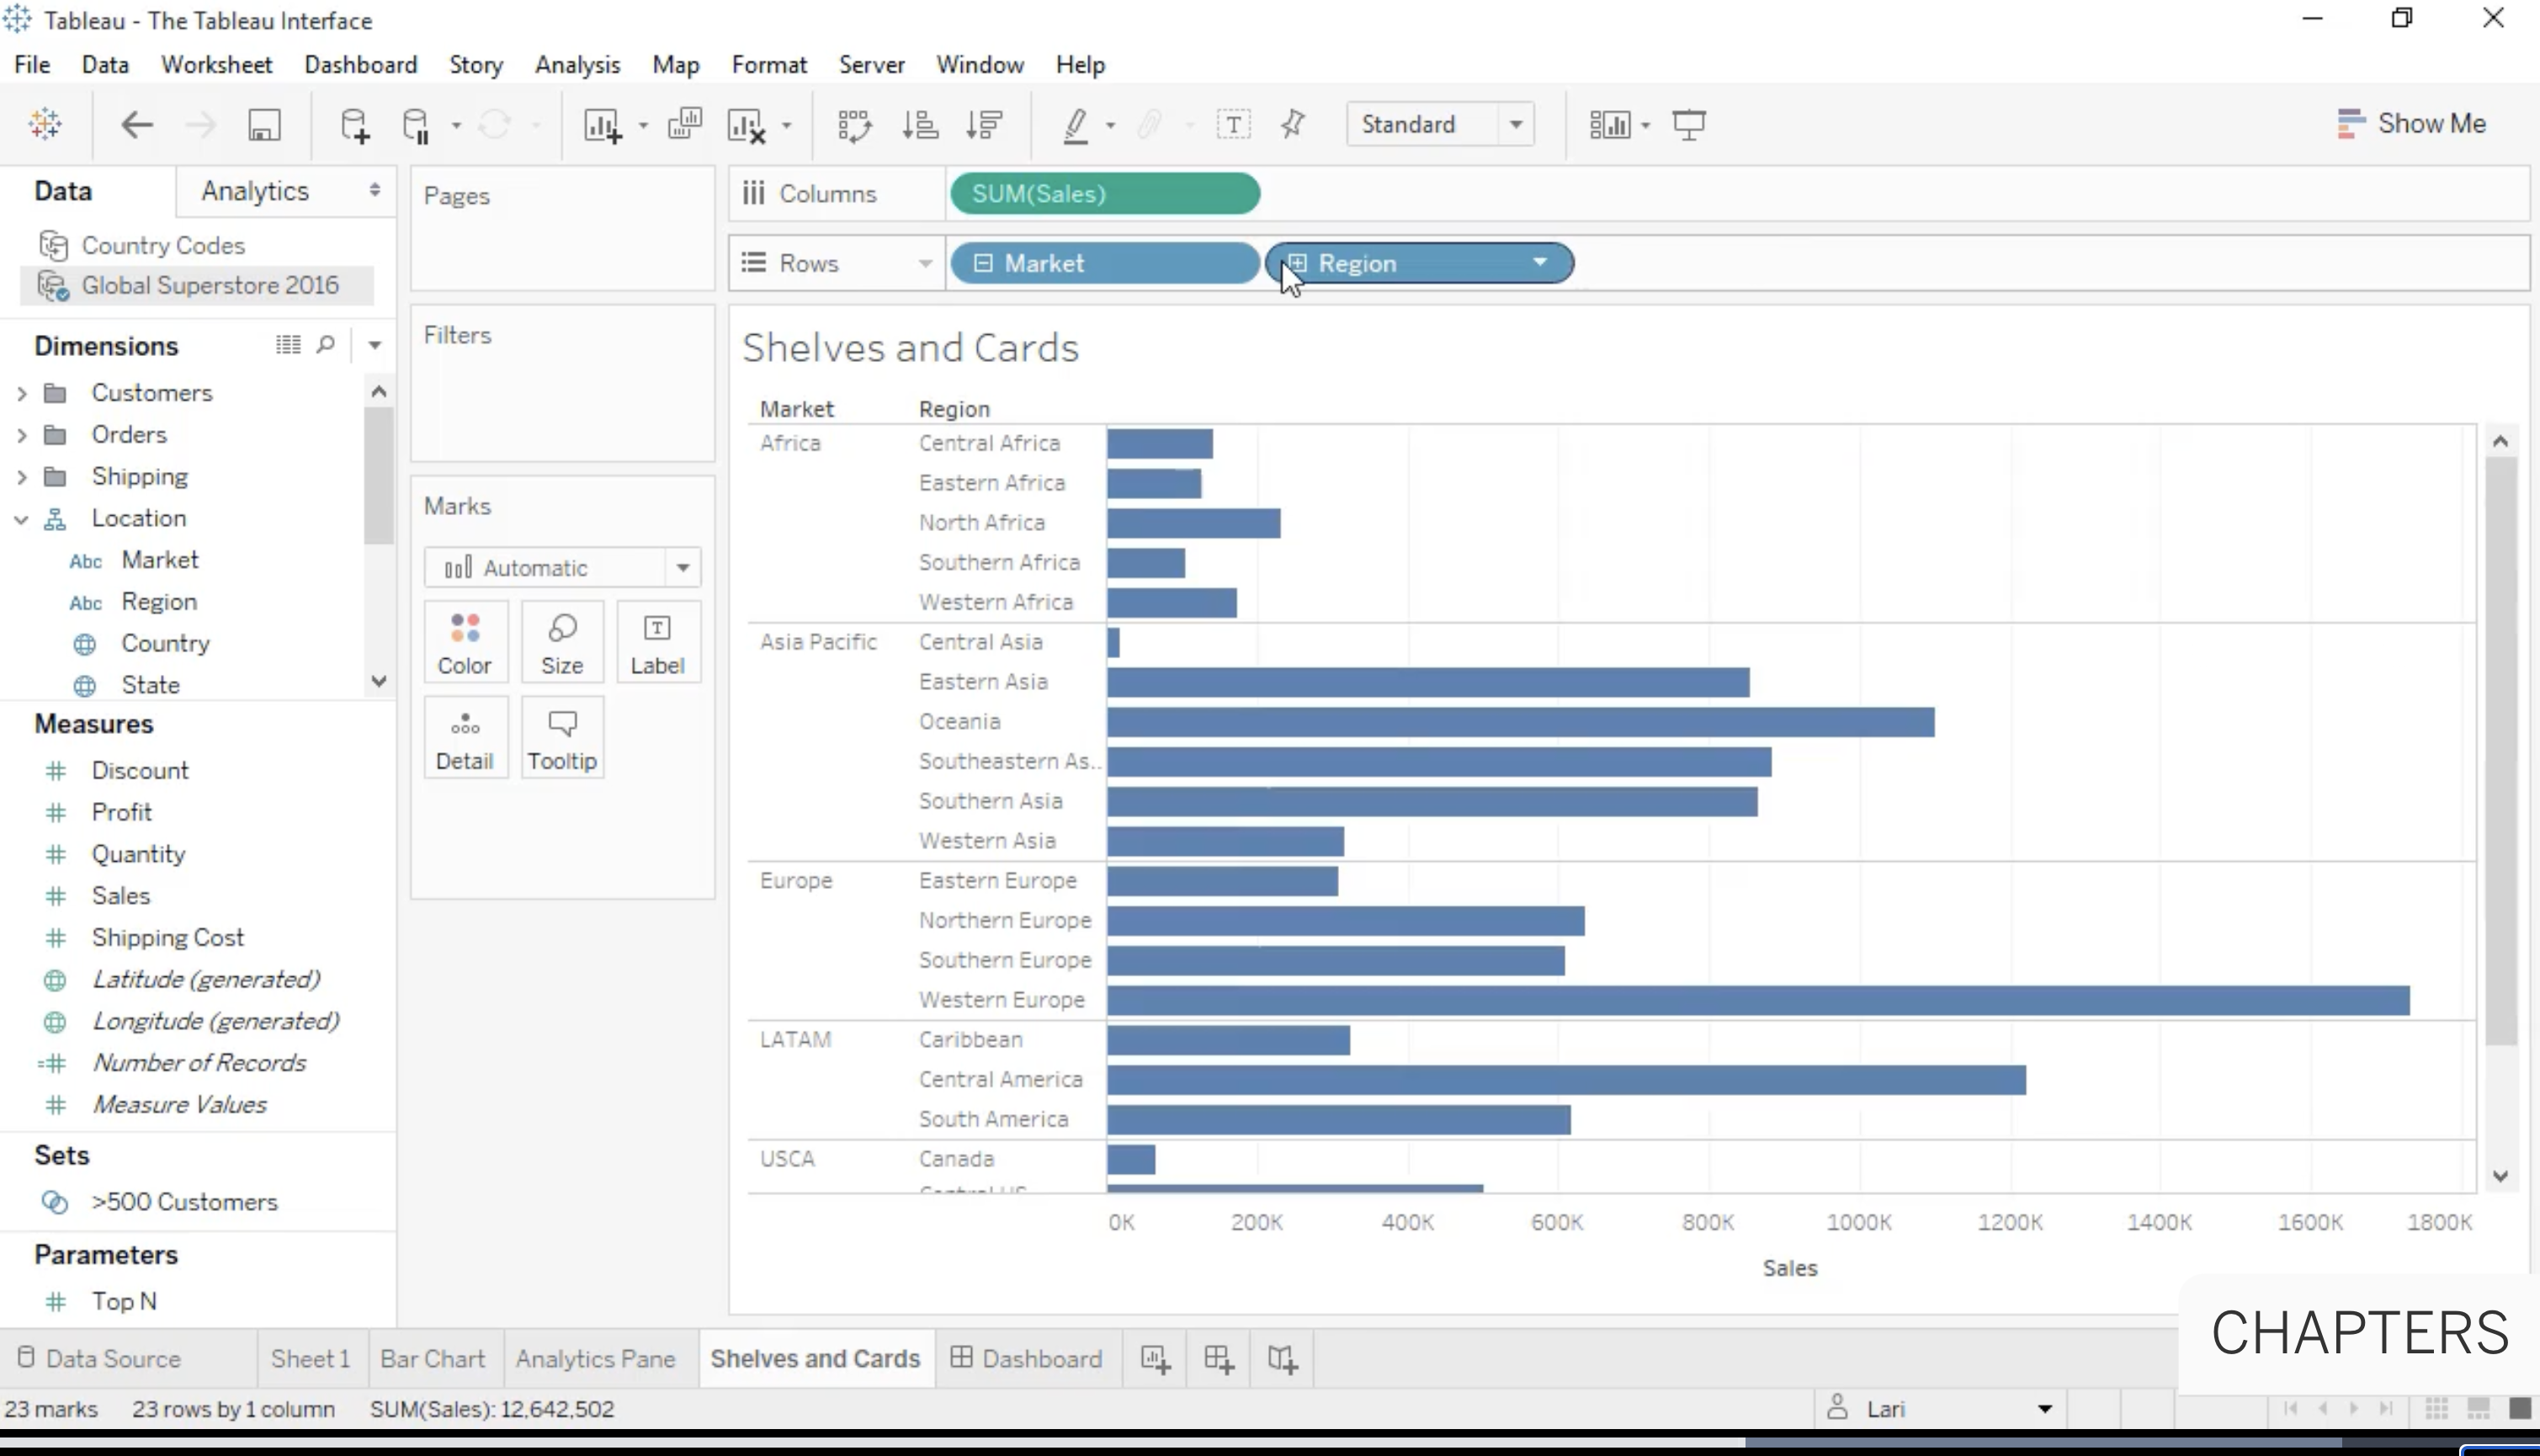
One of the biggest data visualisation software programmes, Tableau, also has its roots in the Grammar of Graphics. Tableau is different from the above mentioned implementations, because it uses a graphical user interface instead of code and text. Users can drag columns in their data and drop them onto visual properties of the elements of a visualisation. Behind the scenes, Tableau is using a Grammar of Graphics based language to store the specifications of visualisations created with the tool.

Source: tableau.com