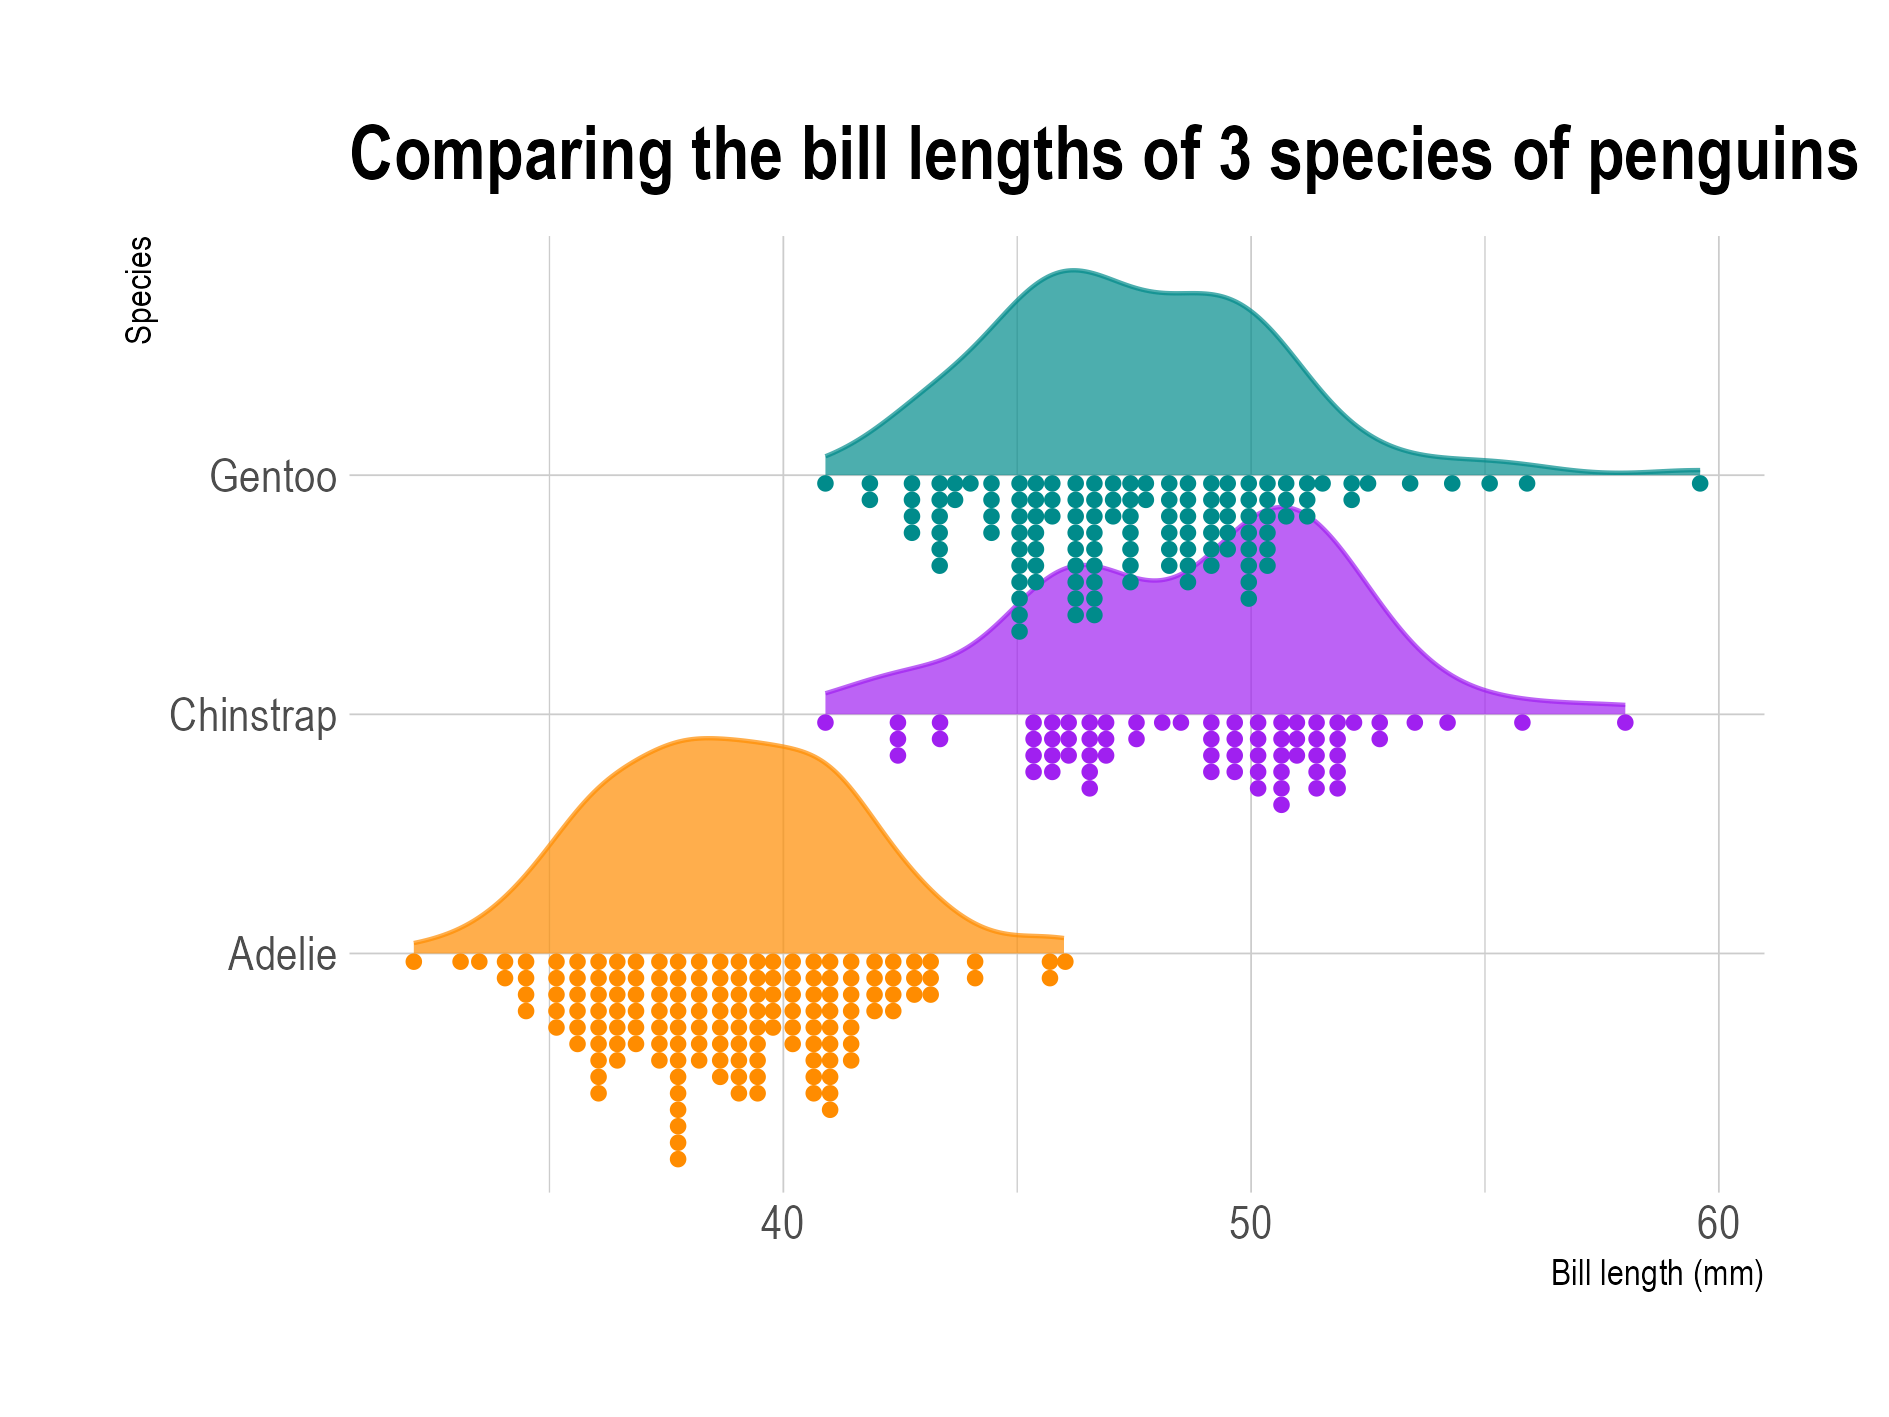
A scatter plot is a relatively simple chart type, and describing it is not a very difficult task. But would it be possible to come up with a good description of a raincloud plot, for example? How would a description for this chart look like?

A raincloud plot shows distributions by combining a density plot with a dot plot. Source: Maarten Lambrechts, CC BY SA 4.0
So the question is: would it be possible to come up with a set of concepts to describe all visualisation types? That is exactly the question that Leland Wilkinson set out to answer when he wrote The Grammar of Graphics.

Cover of the second edition of the Grammar of Graphics. The first edition was published in 1999. Source: springer.com
Wilkinson was a statistician and computer scientist, and he spent part of his career developing statistical graphics software. So he spent a lot of time thinking about how charts and visualisations are constructed, and one of his goals was to make software that would be able to generate any kind of chart type.
I was determined to produce a package that could draw every statistical graphic I had ever seen. - Leland Wilkinson, in the Preface of the Grammar of Graphics
To reach that goal, Wilkinson studied the deep underlying structures involved in producing different chart types from data. In the Grammar of Graphics he lays out the foundational building blocks of data visualisation, common to all chart types.
In linguistics, the study of language, the term “grammar” refers to a set of rules that should be followed in order to construct meaningful sentences in a language. Wilkinson wanted to find the rules that should be followed in order to construct perceivable and correct visualisations from data. This involves both mathematics and, what he calls, aesthetics:
This book is about grammatical rules for creating perceivable graphs, or what I call graphics. These rules are sometimes mathematical and sometimes aesthetic. Mathematics provides symbolic tools for representing abstractions. Aesthetics, in the original Greek sense, offers principles for relating sensory attributes (color, shape, sound, etc.) to abstractions. In modern usage, aesthetics can also mean taste. This book is not about good taste, practice, or graphic design, however. This book focuses instead on rules for constructing graphs mathematically and then representing them as graphics aesthetically. - Leland Wilkinson, in the Preface of the Grammar of Graphics
The Grammar of Graphics is a big book, and it is not an easy read: it introduces a lot of abstract concepts and contains abstract pseudo code to explain how data visualisations are constructed.

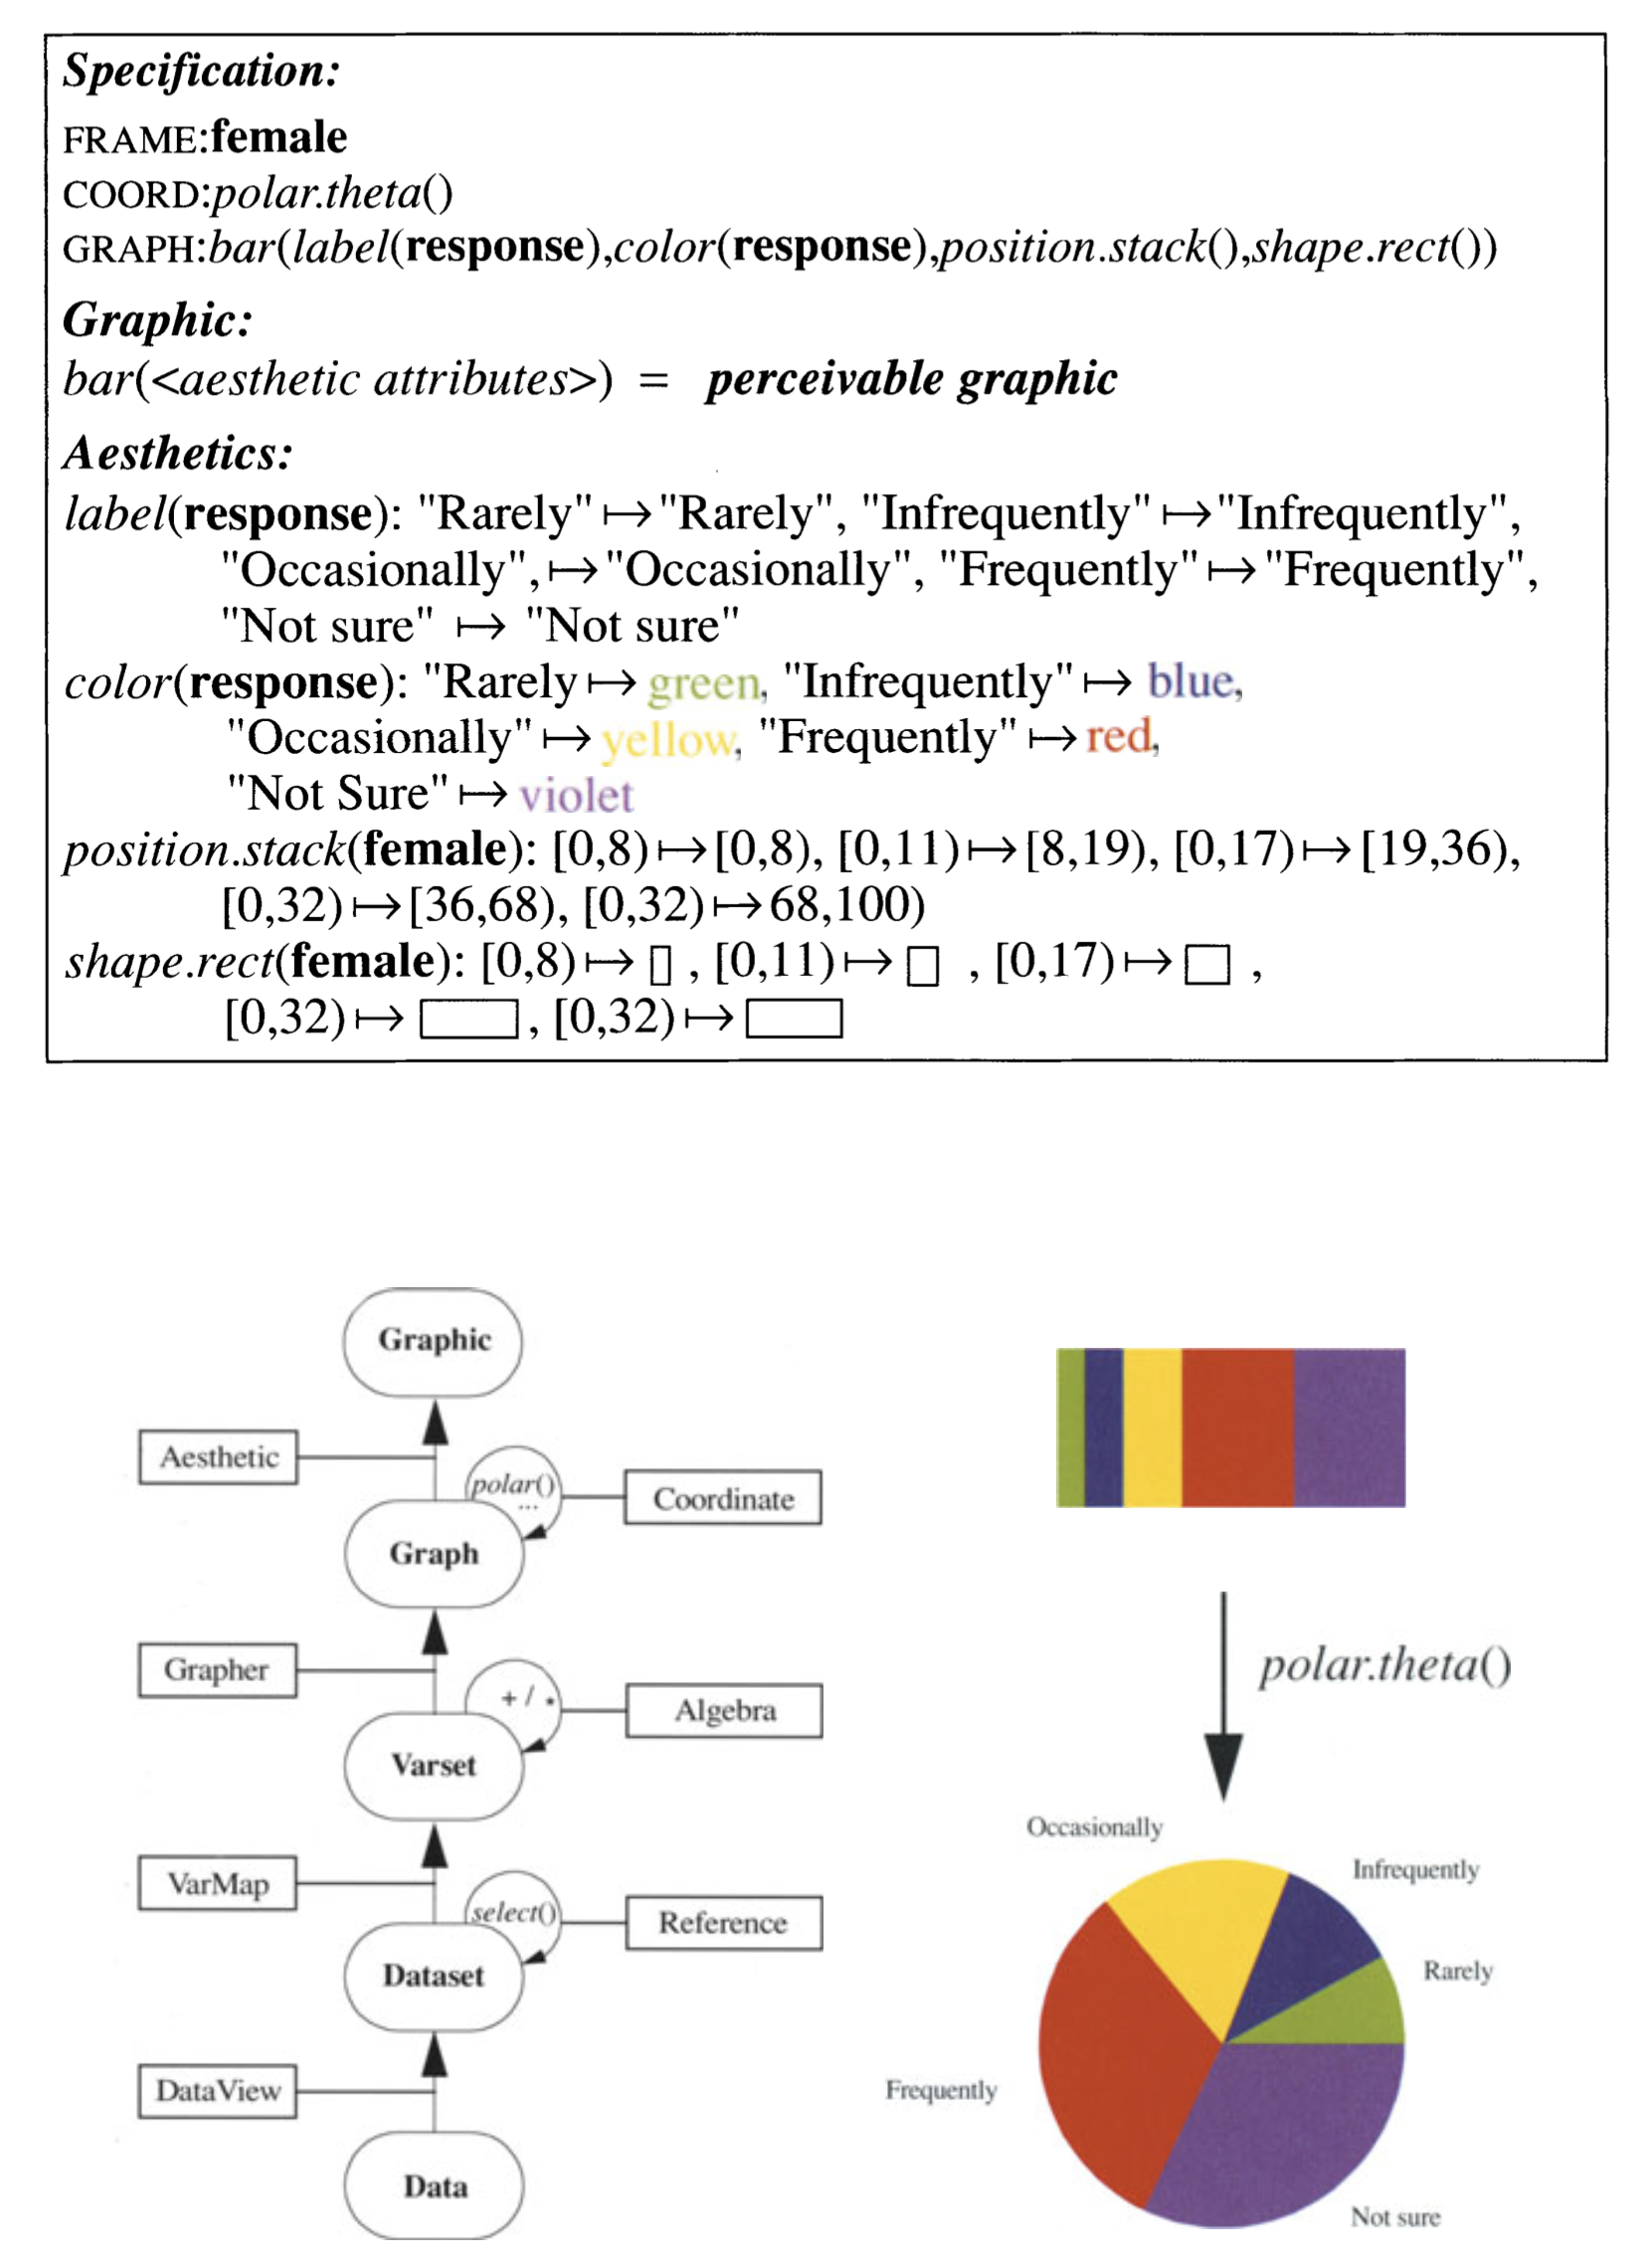
An excerpt from the Grammar of Graphics, showing how a pie chart can be described (a description of a visualisation is called a “specification”). Using the Grammar of Graphics, you’ll understand that a pie chart is just a stacked bar chart using polar coordinates instead of cartesian coordinates. Source: Grammar of Graphics