Paying, desktop app
microsoft.com/en-us/microsoft-365/excel
Because it is so ubiquitous in the business world and outside of it, Excel is one of the most popular tools to produce data visualisations in the world. The interface for making charts is based on a gallery of chart types, but Excel users have been very creative in making many kinds of charts in Excel that are not part of the gallery offered by Excel.

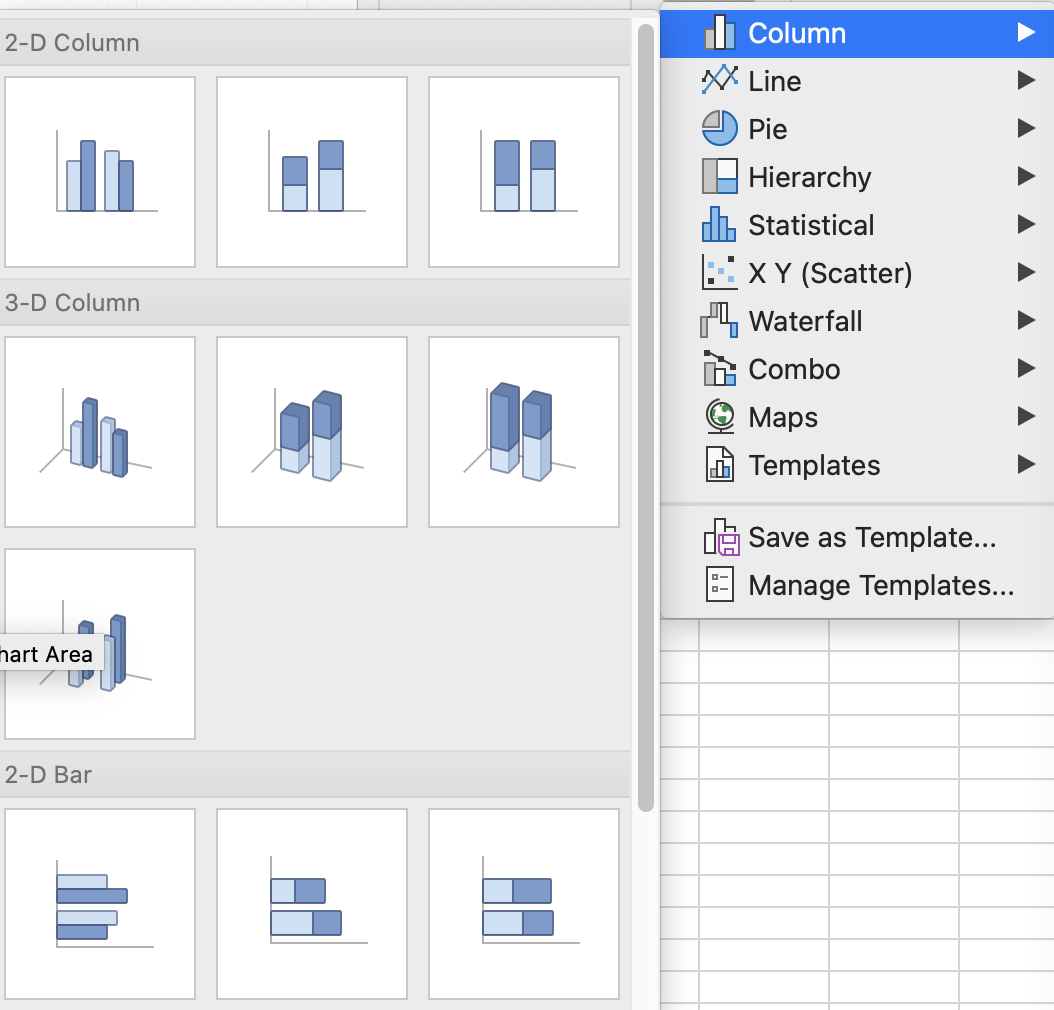
Available chart types in Excel. Source: Maarten Lambrechts, CC BY SA 4.0
Excel’s chart output is mainly static, but because Excel is so flexible, it can also be used to produce interactive charts and dashboards. However, the use of these is limited to Excel itself: you have to have Excel installed to open the file containing the interactive charts.