Paying (free for personal use), JavaScript Library
Highcharts is a JavaScript library for making SVG visualisations in the browser. It is chart template based and has extensive configuration options for interactivity, styling, annotations and accessibility.
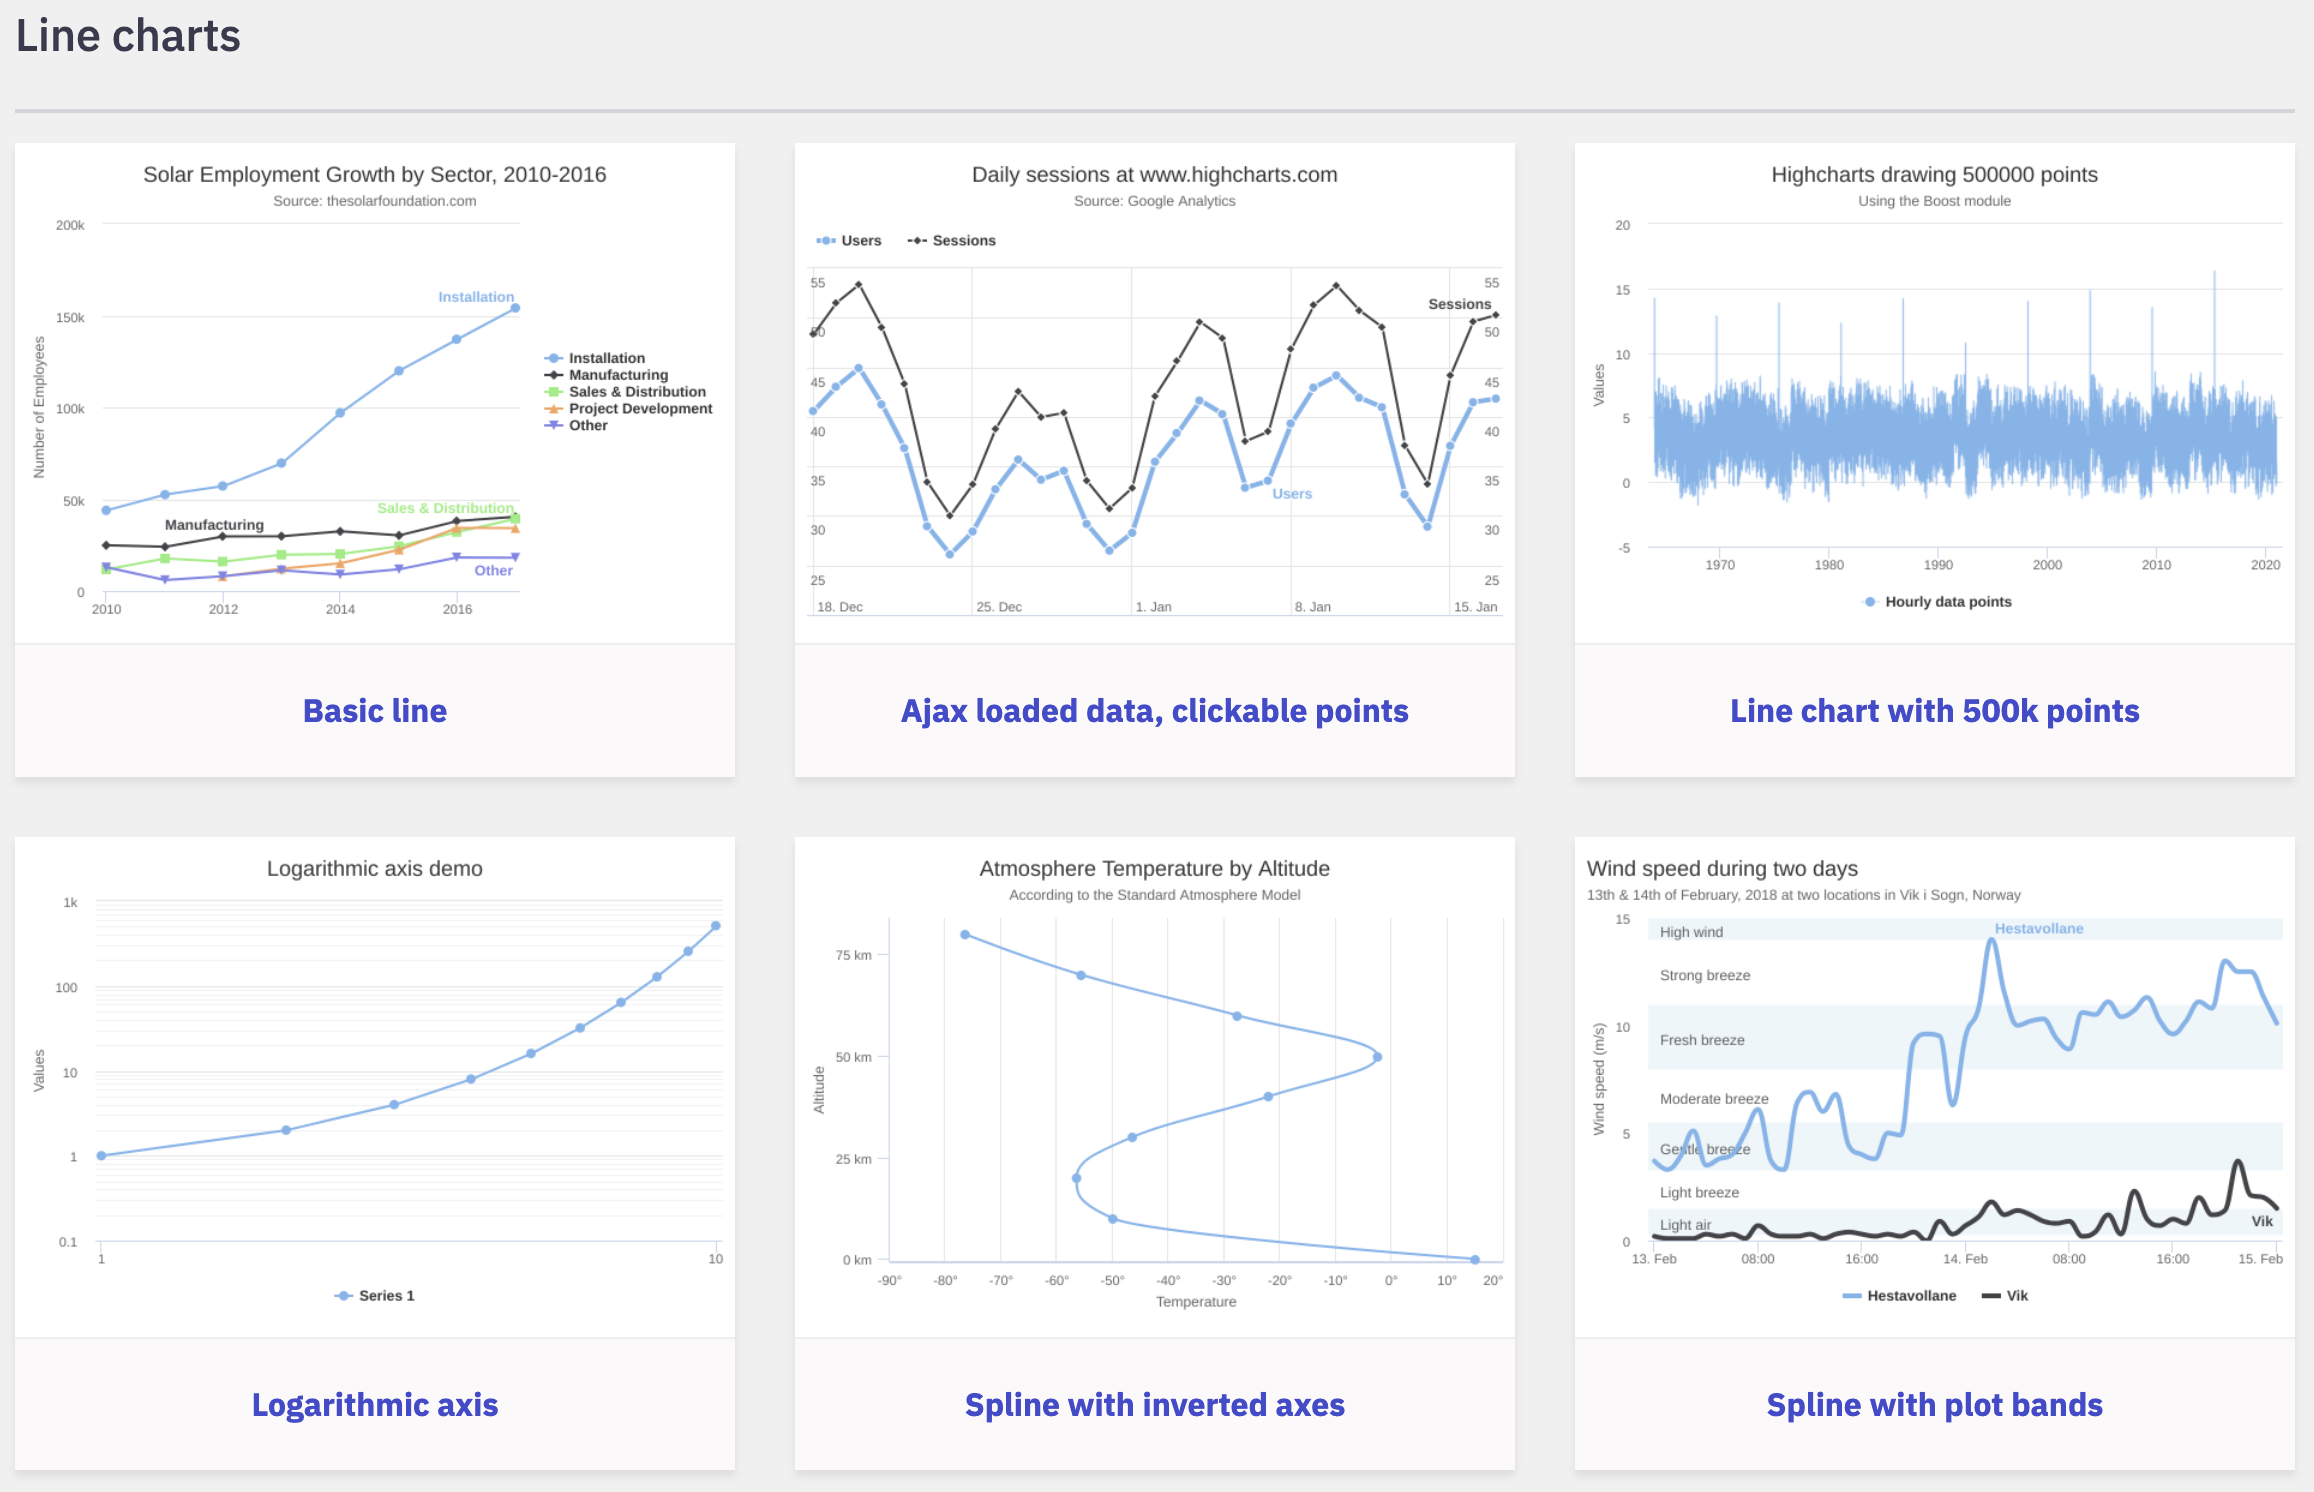
Source: highcharts.com/demo
Highcharts also offers a library for maps, called Highchart Maps.