Free, web app
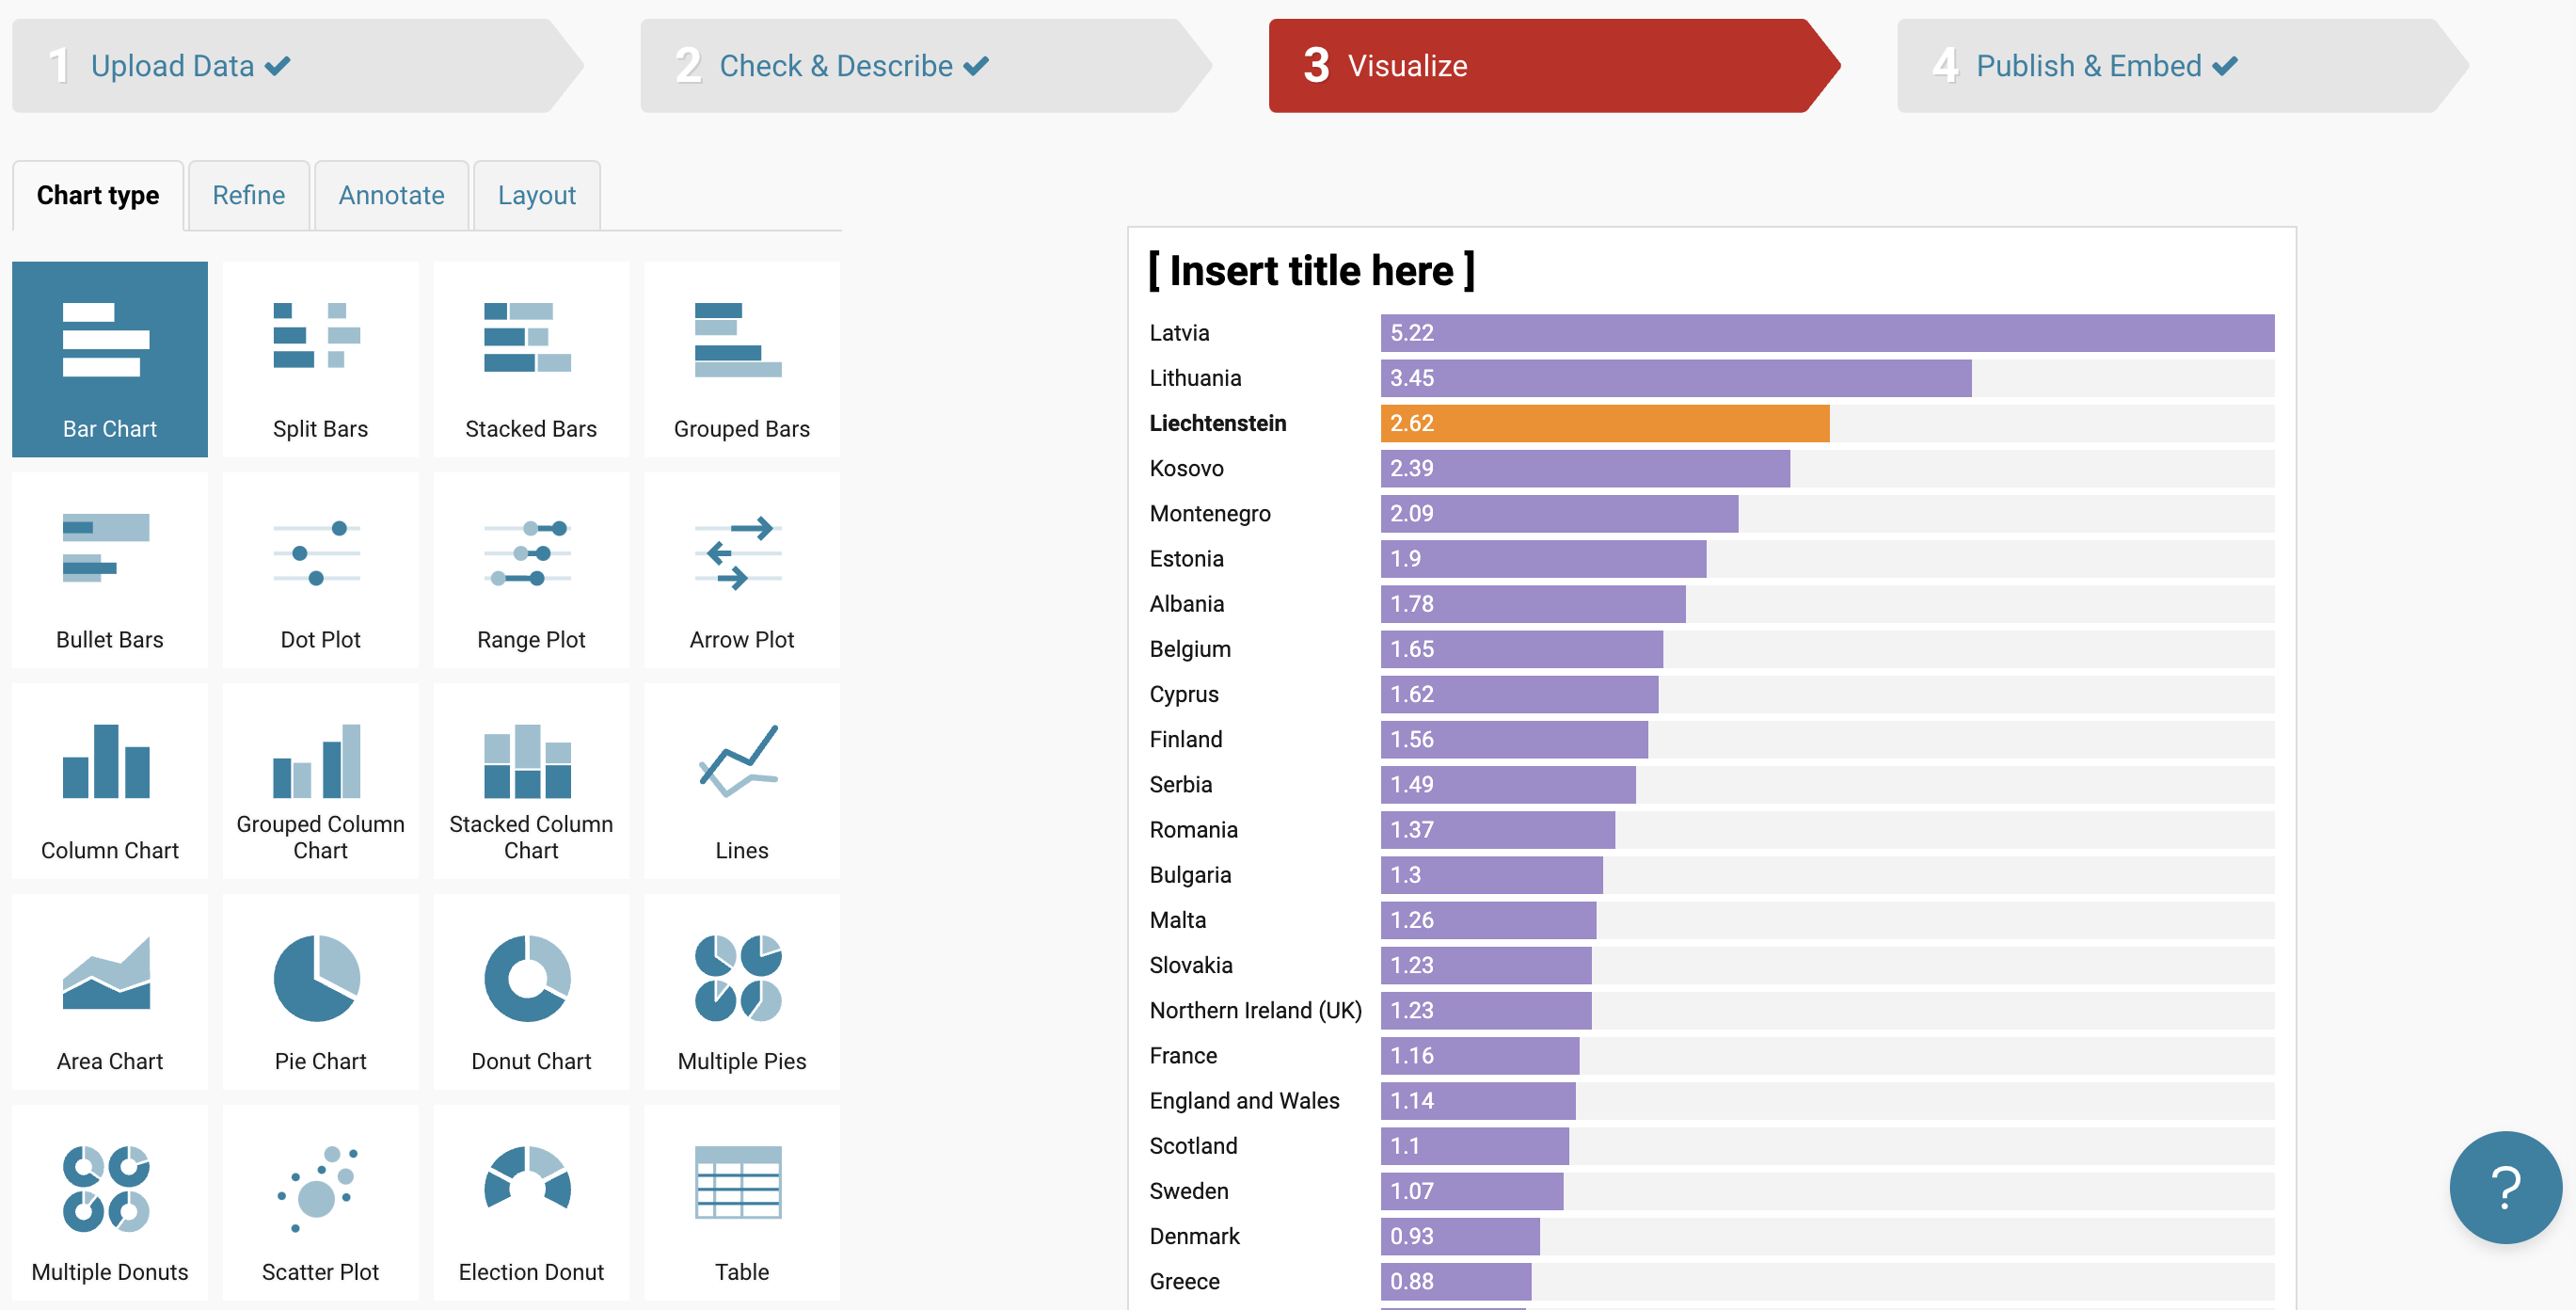
Datawrapper originated as a charting tool for journalists working in newsrooms, but today it is a popular visualisation tools in many different environments. It has a clean, 4 step, user interface and a chart template gallery that only cover basic charts.

The Datawrapper interface. Source: Maarten Lambrechts, CC BY SA 4.0
Data can come from live sources (hosted csv files or Google Sheets) and the output is both static (only PNG files for free accounts) and interactive (tooltips for most charts), with responsive embeddable charts. With Datawrapper you can also make different kind of maps and tables. Custom styling of charts is limited to paying accounts.