Switching the rows and columns of a wide data table is called “transposing” a table. Below you see a wide table and its transposed version.
| Country | 2017 | 2018 | 2019 | 2020 | 2021 |
|---|---|---|---|---|---|
| Belgium | 69,8 | 71 | 71,8 | 71,5 | 71,9 |
| Bulgaria | 71,4 | 72,4 | 75 | 73,4 | 73,2 |
| Czechia | 78,4 | 79,8 | 80,2 | 79,6 | 79,8 |
| Denmark | 77,8 | 78,7 | 79,4 | 78,8 | 79,8 |
Transposed:
| Country | Belgium | Bulgaria | Czechia | Denmark |
|---|---|---|---|---|
| 2017 | 69,8 | 71,4 | 78,4 | 77,8 |
| 2018 | 71 | 72,4 | 79,8 | 78,7 |
| 2019 | 71,8 | 75 | 80,2 | 79,4 |
| 2020 | 71,5 | 73,4 | 79,6 | 78,8 |
| 2021 | 71,9 | 73,2 | 79,8 | 79,8 |
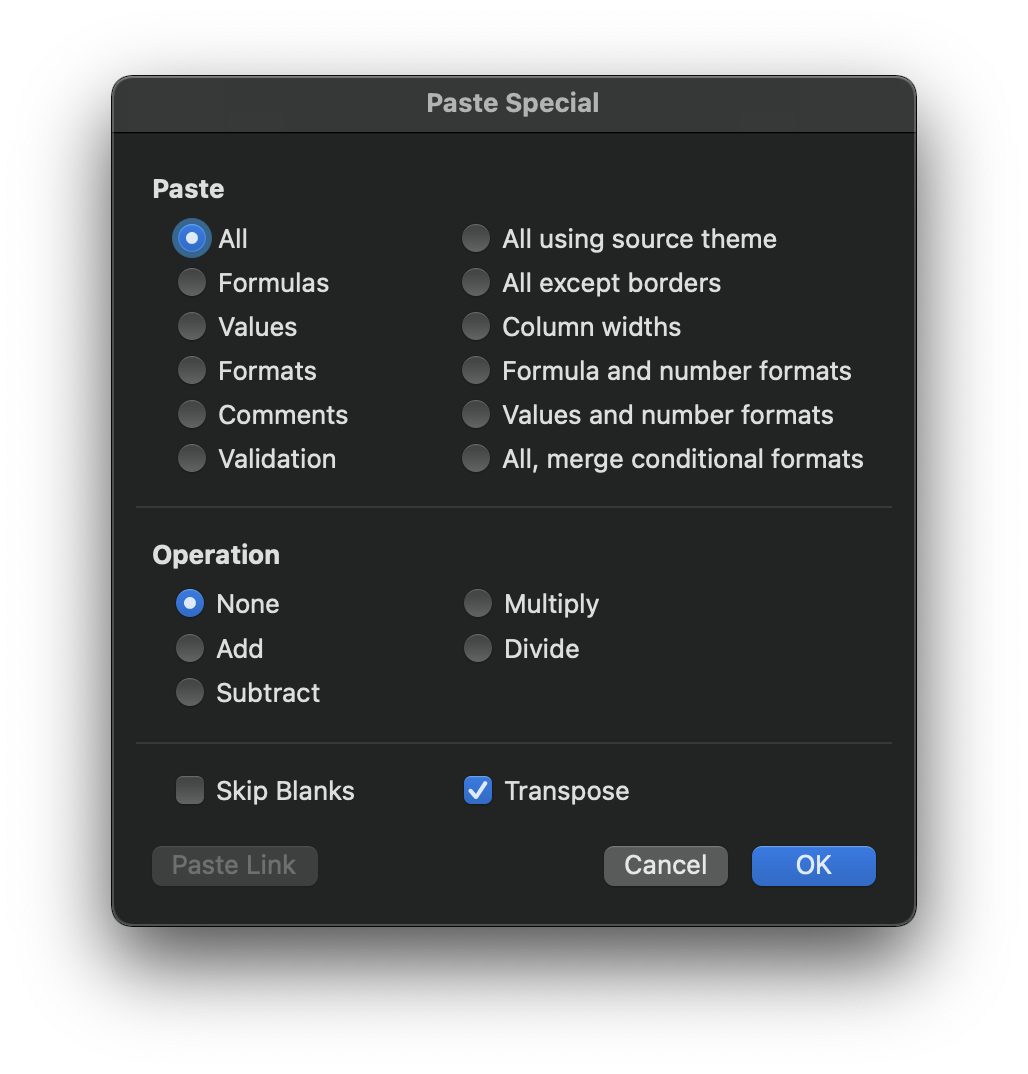
Some visualisation tools are able to transpose the data for you. If the tool you are using does not offer this functionality, you need to transpose the data yourself before inputting it into the tool. This can be easily done in Excel by selecting the data, copying it and checking the “Transpose” option in the Paste Special dialogue.

The Microsoft Paste Special dialogue, with the Transpose checkbox checked in the bottom right. Source: Maarten Lambrechts, CC BY SA 4.0