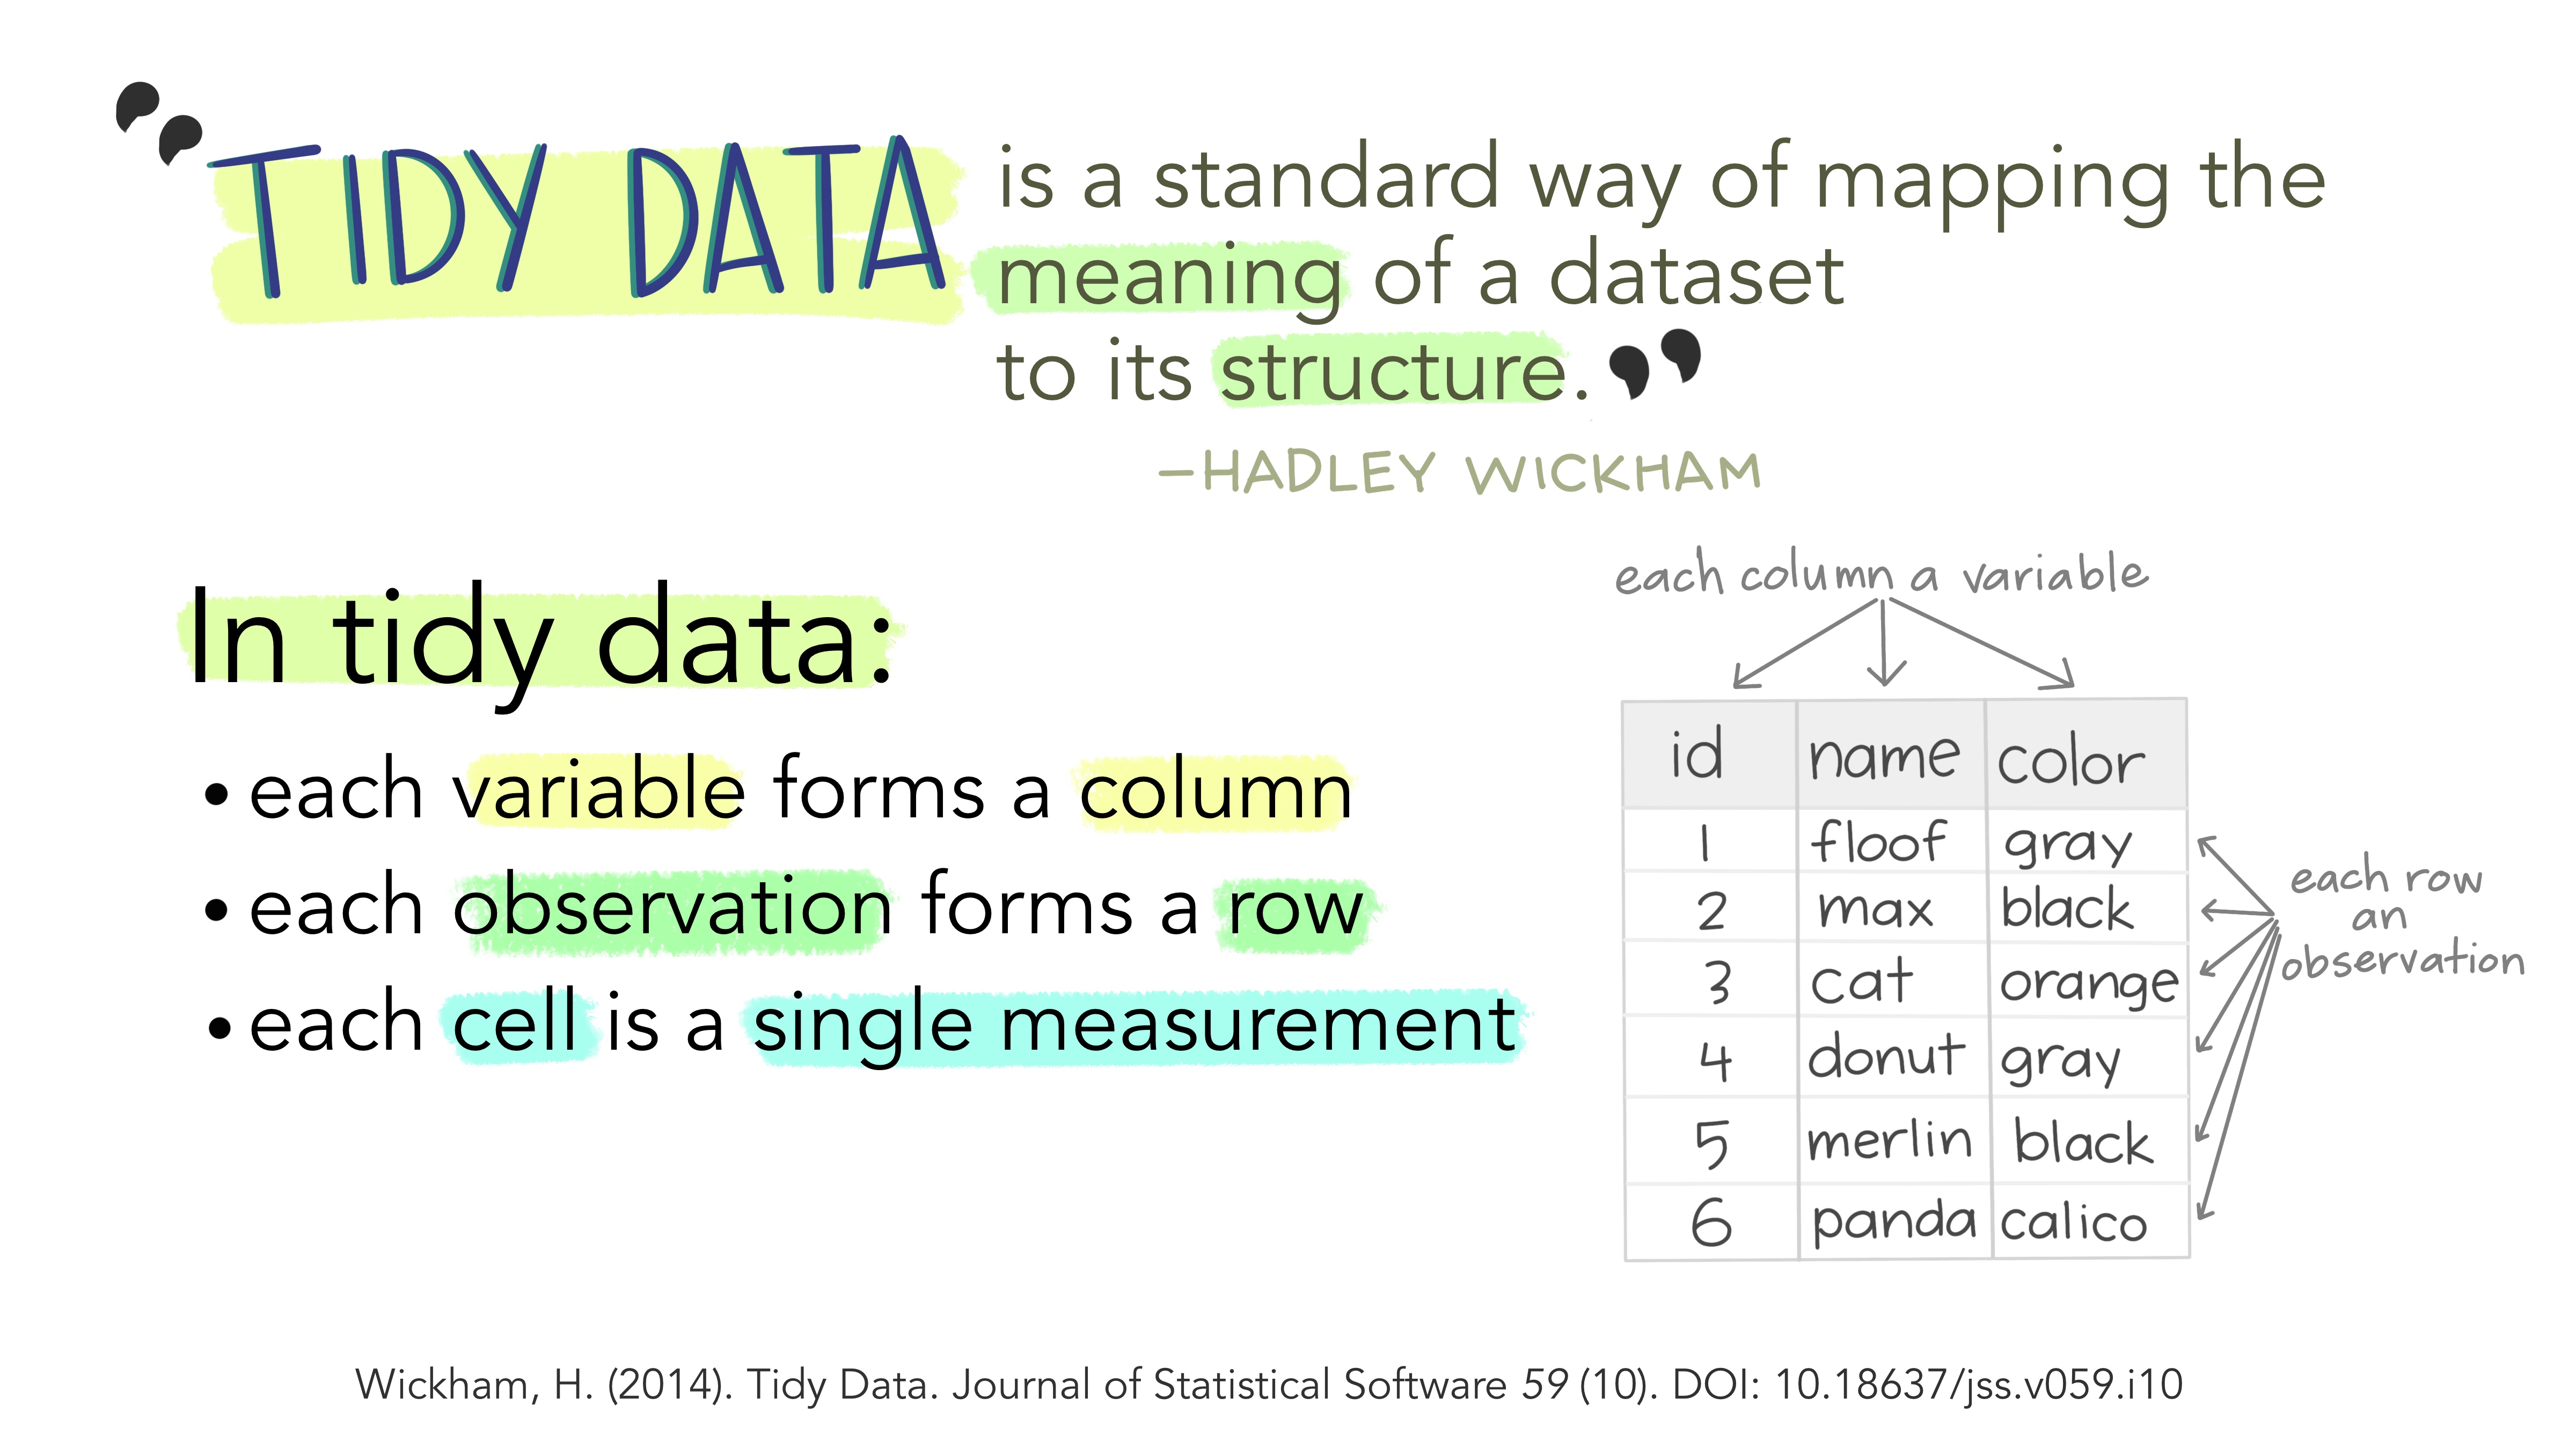
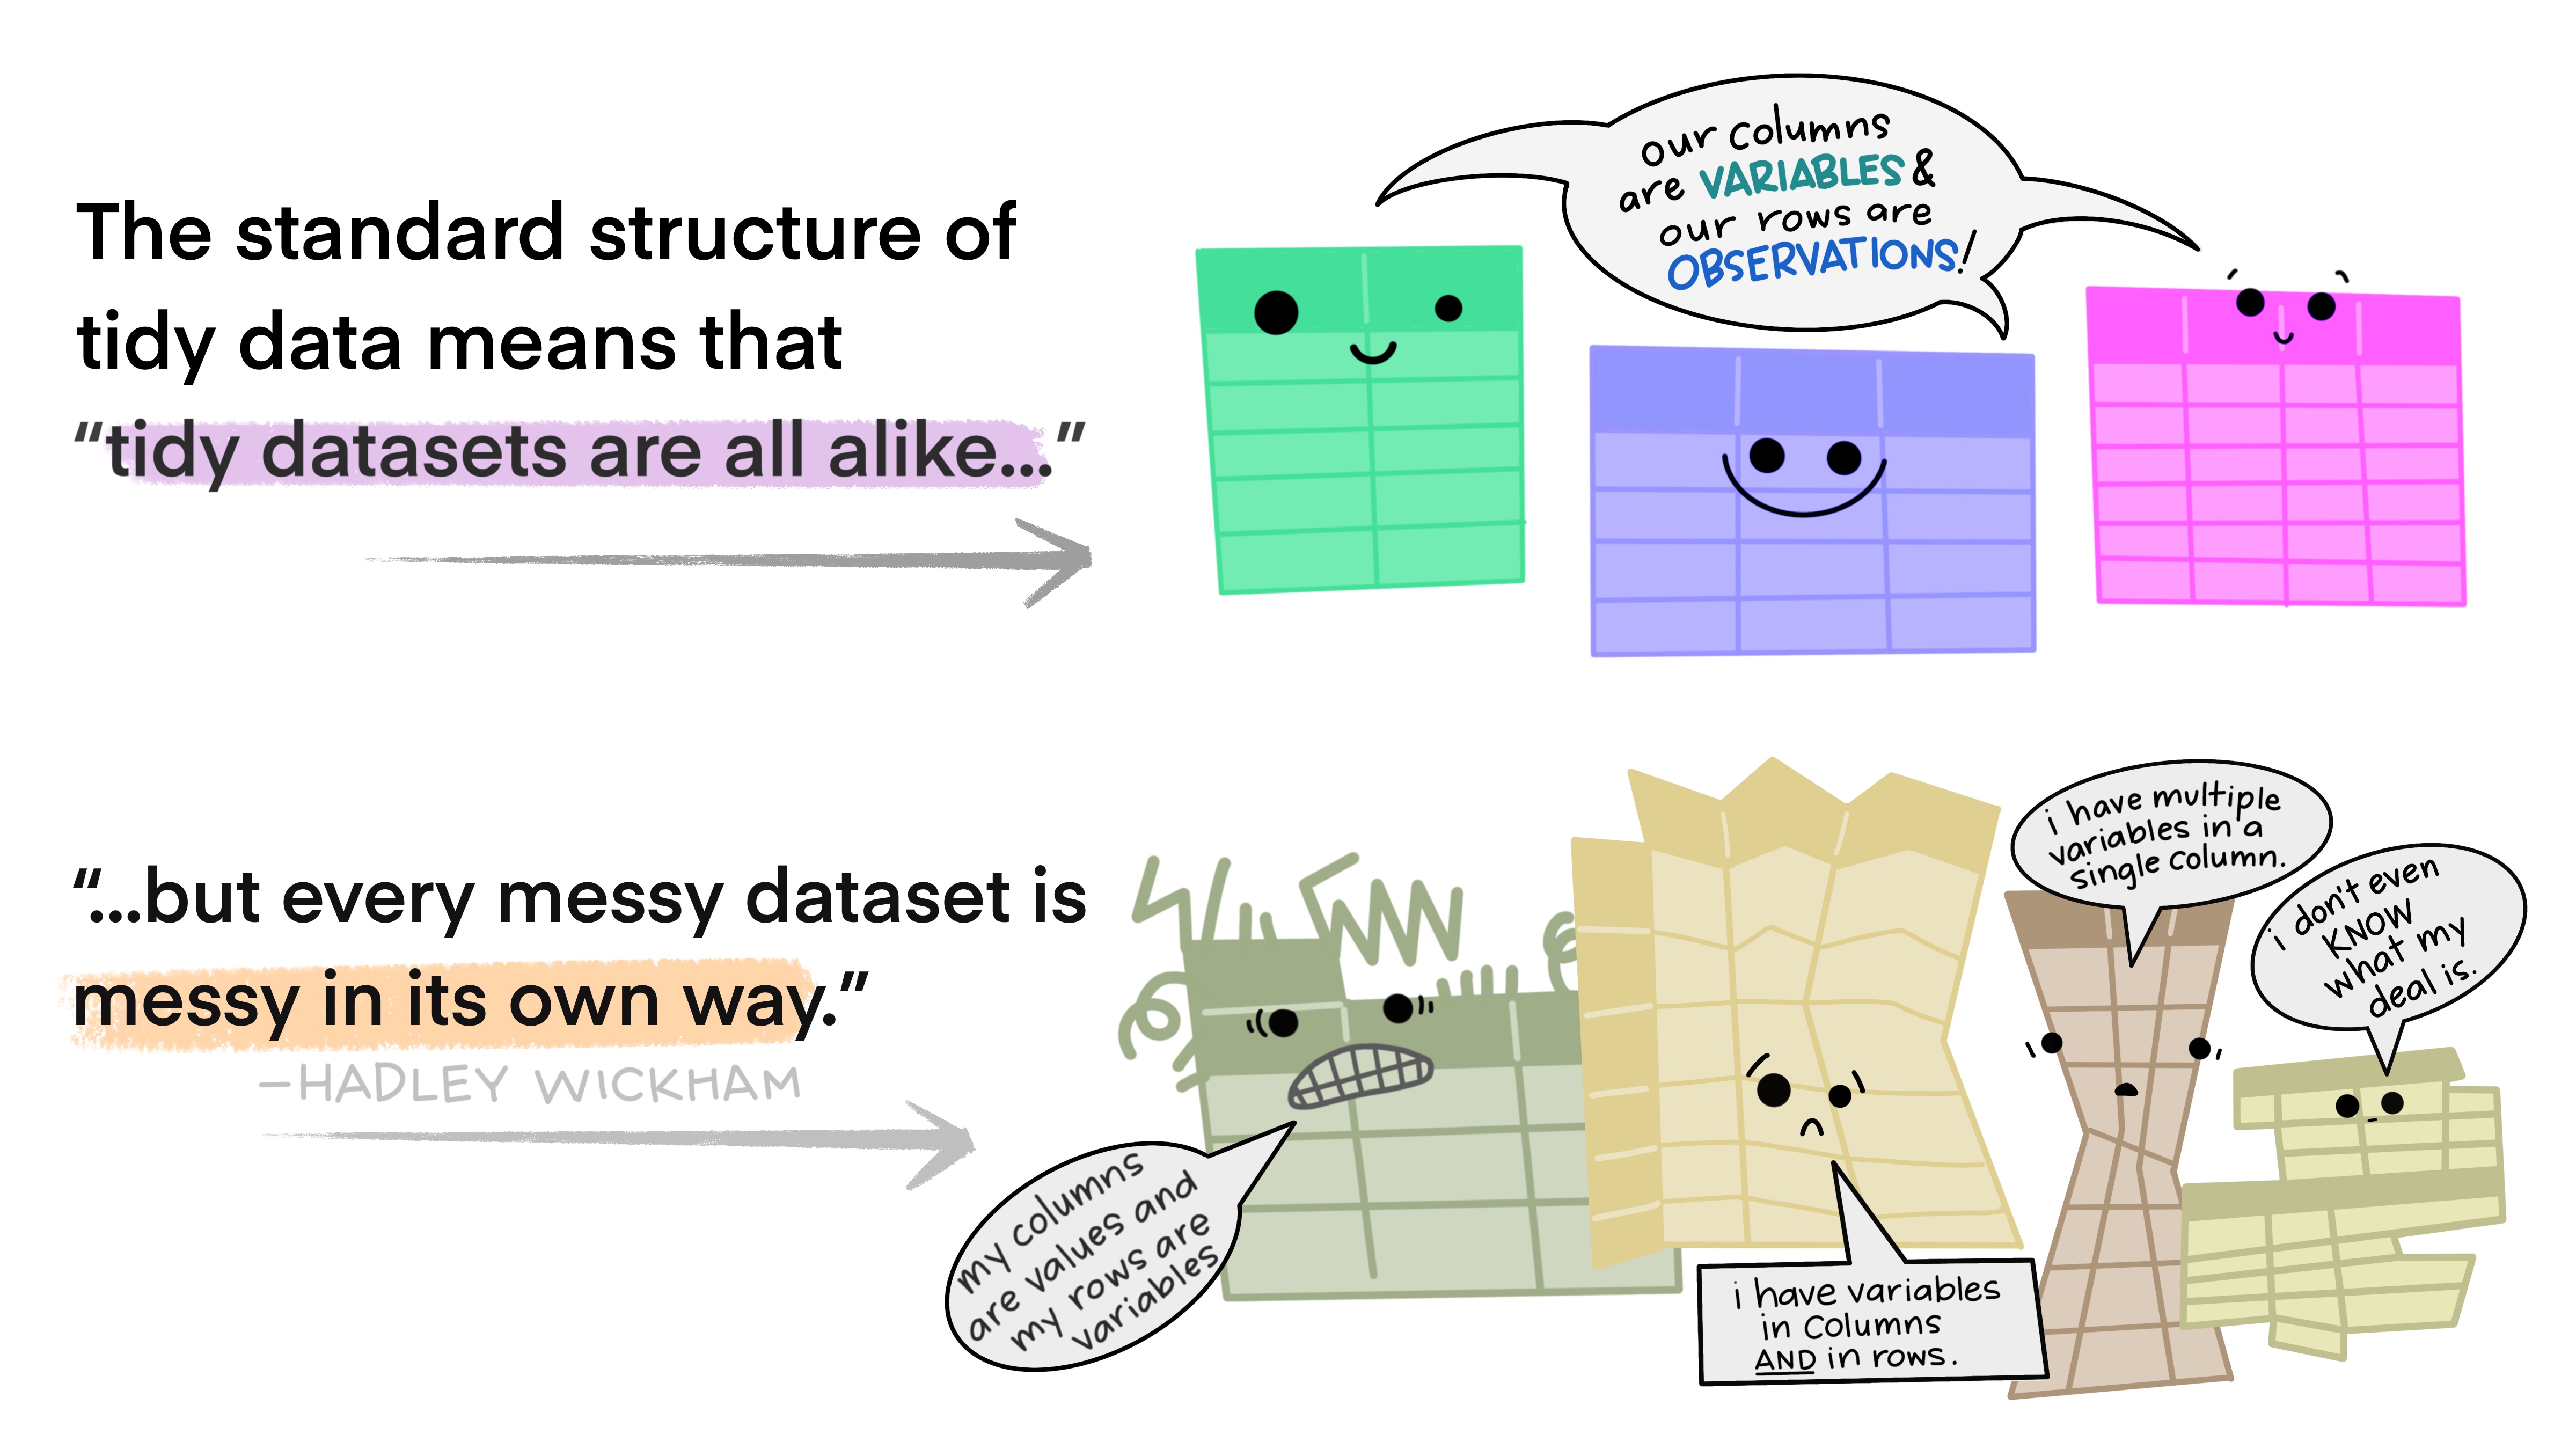
Data can be organised in many different ways. But making visualisations based on the Grammar of Graphics requires your data to be in a certain format called tidy data. It is worth spending some time learning about tidy data, because tidy data is not only the starting point for Grammar of Graphics based visualisations, it is also a good base for data analysis, and a very good guide for how to handle, store, transform and exchange data.

Source: Alison Horst, CC BY 4.0
Variables, observations and values
Consider the following data table:
| country | year | cases | population |
|---|---|---|---|
| Belgium | 2020 | 14.444 | 11.522.440 |
| Belgium | 2021 | 14.791 | 11.554.767 |
| Bulgaria | 2020 | 23.128 | 6.916.548 |
| Bulgaria | 2021 | 22.305 | 6.951.482 |
| Czechia | 2020 | 8.610 | 10.494.836 |
| Czechia | 2021 | 8.990 | 10.693.939 |
In this table, country, year, cases and population are variables. A variable contains all values that measure the same underlying attributes across units.
Every row except the header row is an observation. An observation contains all values measured on the same unit across attributes. In this case the observations each represent a country.
Each cell in the table (again: except the ones in the first row) contains a value. A value represents a single measurement of an attribute of a unit, and can be a number in the case of quantitative measurements, or a string in the case of qualitative measurements.
The table above is in the tidy data format, because it respects the 3 rules of tidy data:
- Every column is a variable.
- Every row is an observation.
- Every cell is a single value.

Source: Alison Horst, CC BY 4.0
This seems very straightforward and logical. But let’s see how the same data set can be structured differently, and what makes these other structures non-tidy.
Here is a first alternative structure of the table, in which the cases and population columns are replaced by a type and a count column.
| country | year | type | count |
|---|---|---|---|
| Belgium | 2020 | cases | 14.444 |
| Belgium | 2020 | population | 11.522.440 |
| Belgium | 2021 | cases | 14.791 |
| Belgium | 2021 | population | 11.554.767 |
| Bulgaria | 2020 | cases | 23.128 |
| Bulgaria | 2020 | population | 6.916.548 |
| Bulgaria | 2021 | cases | 22.305 |
| Bulgaria | 2021 | population | 6.951.482 |
| Czechia | 2020 | cases | 8.610 |
| Czechia | 2020 | population | 10.494.836 |
| Czechia | 2021 | cases | 8.990 |
| Czechia | 2021 | population | 10.693.939 |
Can you see how this table violates the rules of tidy data?
The table is untidy because not every column is a variable: the count column contains the values of 2 variables (which are specified in the type column).
You could also say that each observation (= a country in a single year) does not have its own, single row in the table: every observation has 2 rows.
Let’s have a look at another table structure:
| country | year | rate |
|---|---|---|
| Belgium | 2020 | 14.444/11.522.440 |
| Belgium | 2021 | 14.791/11.554.767 |
| Bulgaria | 2020 | 23.128/6.916.548 |
| Bulgaria | 2021 | 22.305/6.951.482 |
| Czechia | 2020 | 8.610/10.494.836 |
| Czechia | 2021 | 8.990/10.693.939 |
You will probably note the issue with this table quickly: the rate column contains 2 variables (the number of cases and the population count), and as such violates the rules for tidy data.
A similar violation of the tidy data rules would be the following table:
| country_year | cases | population |
|---|---|---|
| Belgium_2020 | 14.444 | 11.522.440 |
| Belgium_2021 | 14.791 | 11.554.767 |
| Bulgaria_2020 | 23.128 | 6.916.548 |
| Bulgaria_2021 | 22.305 | 6.951.482 |
| Czechia_2020 | 8.610 | 10.494.836 |
| Czechia_2021 | 8.990 | 10.693.939 |
Here the country_year column is violating the “1 column = 1 variable” rule (or: cells in the column are violating the “1 cell = 1 value” rule).
Another representation of the same data is this combo of a “Cases” table and a “Population” table:
Cases:
| country | 2020 | 2021 |
|---|---|---|
| Belgium | 14.444 | 14.791 |
| Bulgaria | 23.128 | 22.305 |
| Czechia | 8.610 | 8.990 |
Population:
| country | 2020 | 2021 |
|---|---|---|
| Belgium | 11.522.440 | 11.554.767 |
| Bulgaria | 6.916.548 | 6.951.482 |
| Czechia | 10.494.836 | 10.693.939 |
Both small tables are untidy, because the 2020 and 2021 column names are actually values of the year variable. Both tables could be turned into tidy data, but each observation would have a row in both tables, and so the “1 row = 1 observation” rule would not be respected when considering the two tables together.

Source: Alison Horst, CC BY 4.0