Images are obviously important HTML elements for data visualisation. An image can be embedded into a HTML page with the <img> tag. The src attribute is required and specifies the location where the image should be loaded from (see the example in HTML elements).
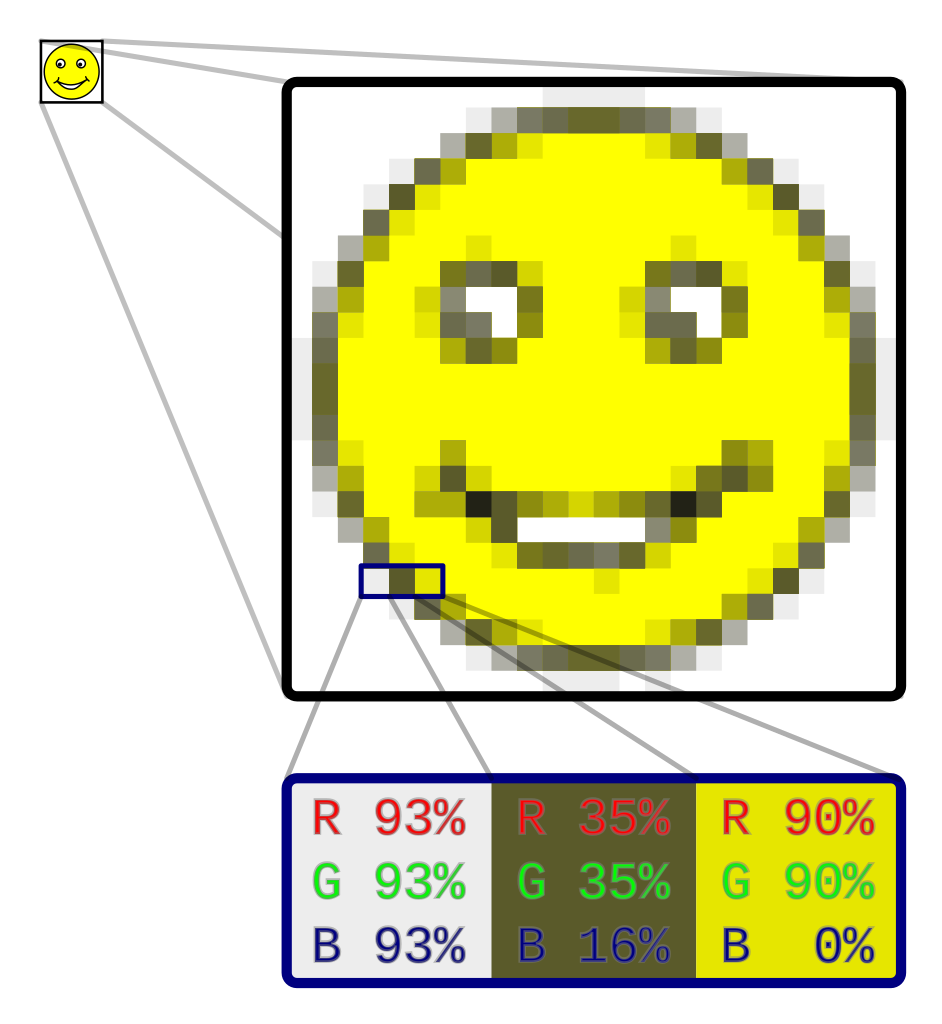
Images can be of different formats. The most common formats are JPG, PNG and GIF files. All three of these formats are bitmap images, which means that the content of the images is stored as a two dimensional grid of square pixels, each with its associated colour value.

An enlarged view on a bitmap image, showing the colour values stored in 3 pixels. Source: Gringer, CC0
In contrast to bitmap images, vector images contain elements described with coordinates in a 2-dimensional plane. For example, a circle in a vector image can be described with the location of its centre (in both the x an y direction), its radius and its fill colour.
<circle cx="100" cy="50" r="50" fill="orange">
</circle>
Compared to raster graphics, vector graphics are more precise (the location of visual elements can be exactly described) and as such it is a popular file format in engineering and architecture software. But it is also popular in online data visualisation, because it lends itself well for interaction and animation. When a graphic can be decomposed into simple geometric elements, like circles, lines and polygons, vector graphics usually have smaller file sizes than raster graphics, which is important for the loading time of a web page.
In HTML, vector images can be embedded with the <svg> element (SVG stands for Scalable Vector Graphics). The SVG children elements <rect>, <circle> , <line> (see SVG elements: geometric shapes)and <text> (see SVG elements: text) can be used to draw rectangles, circles, lines and text respectively.
<svg width="400" height="400">
  <rect
		x="0"
		y="0"
		fill="#fff"
		stroke="black"
		width="400"
		height="400"/>
	<rect
		x="25"
		y="25"
		fill="lime"
		stroke-width="4"
		stroke="green"
		width="200"
		height="200" />
	<circle
		cx="125"
		cy="125"
		r="75"
		fill="orange" />
	<polyline
		points="50,150 50,200 200,200 200,100"
		stroke="purple"
		stroke-width="4"
		fill="none" />
	<line
		x1="50"
		y1="50"
		x2="200"
		y2="200"
		stroke="steelblue"
		stroke-width="4"
		stroke-dasharray="8 8"/>
</svg>
Source: Maarten Lambrechts, CC BY SA 4.0
Standalone SVG images can be loaded with <img> tags, just like bitmap images. But because SVG is part of HTML, SVG images can also be written “inline”, directly in the HTML of a web page.
Like any other element in HTML, interaction behaviour can be defined for elements in SVG. The browser can “listen” to events like the user hovering over an element with the cursor, or the user clicking an element. When the event happens, the browser is instructed to update the page. A common technique in data visualisation is to show a tooltip when the user hovers over the graphical elements in a chart, and hide it when the user stops hovering over the element.