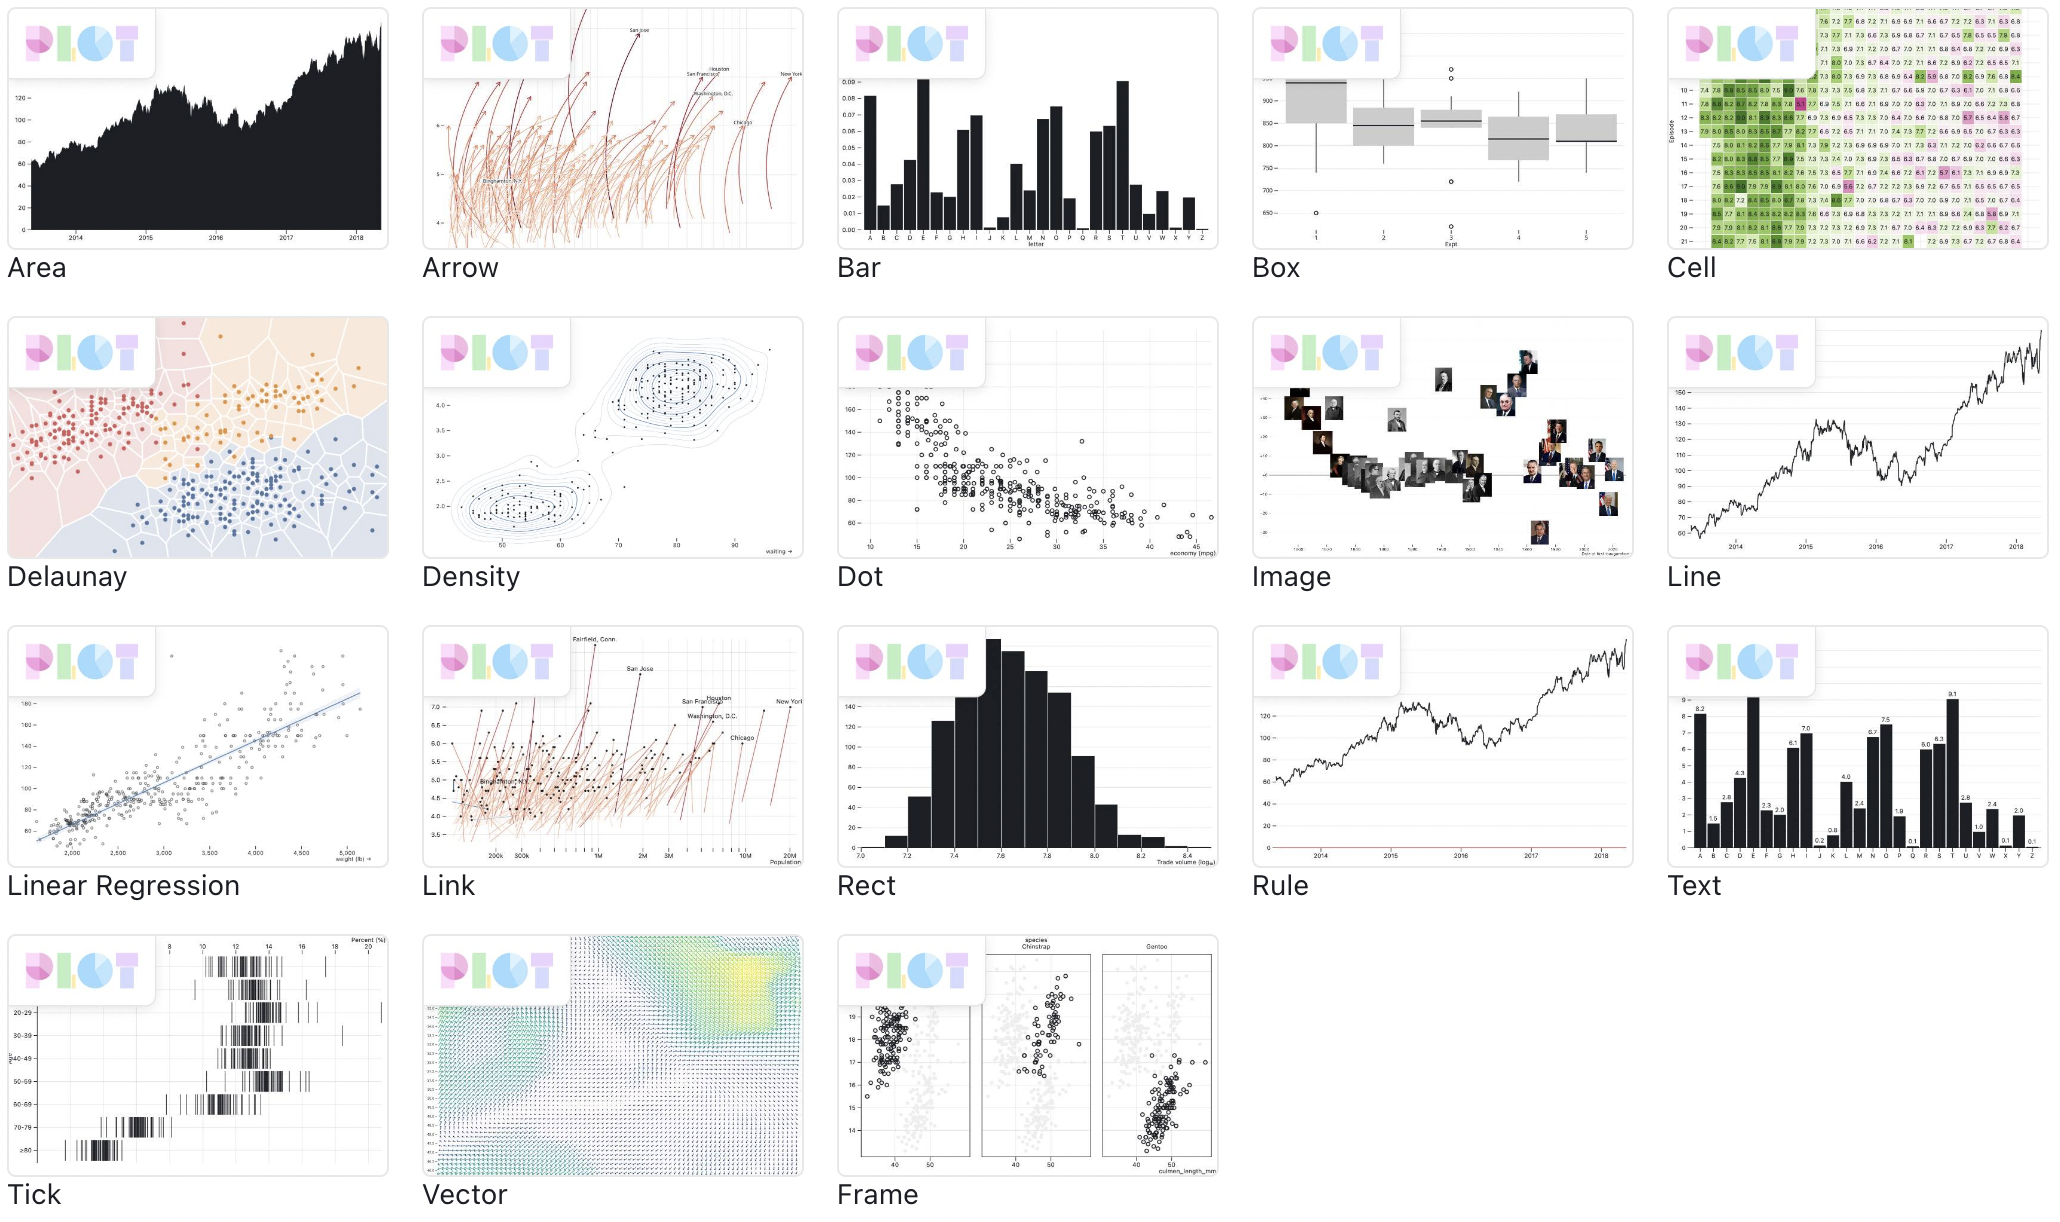
Geometric objects (sometimes also called “geoms”, or “marks”) are the elements in a chart that carry the encoded data as visual properties. The geometries determine the resulting type of plot. For example with points as geometric objects, you can create a scatter plot, while with a line geometry you produce line charts.
Geometric objects can be divided into 3 main categories, based on their dimensionality:
- point geometries have zero dimensions, and are tied to a single location in a plot. Text geometries, used for placing text on a plot, are also considered point geometries, because they are also tied to a single location
- path and line geometries are 1-dimensional. They can be used to connect points belonging to the same group, and they can create straight lines as well as curves
- rectangles, other polygons and other shapes are 2-dimensional geoms

The geometric objects available in Observable Plot. Source: observablehq.com/@observablehq/plot