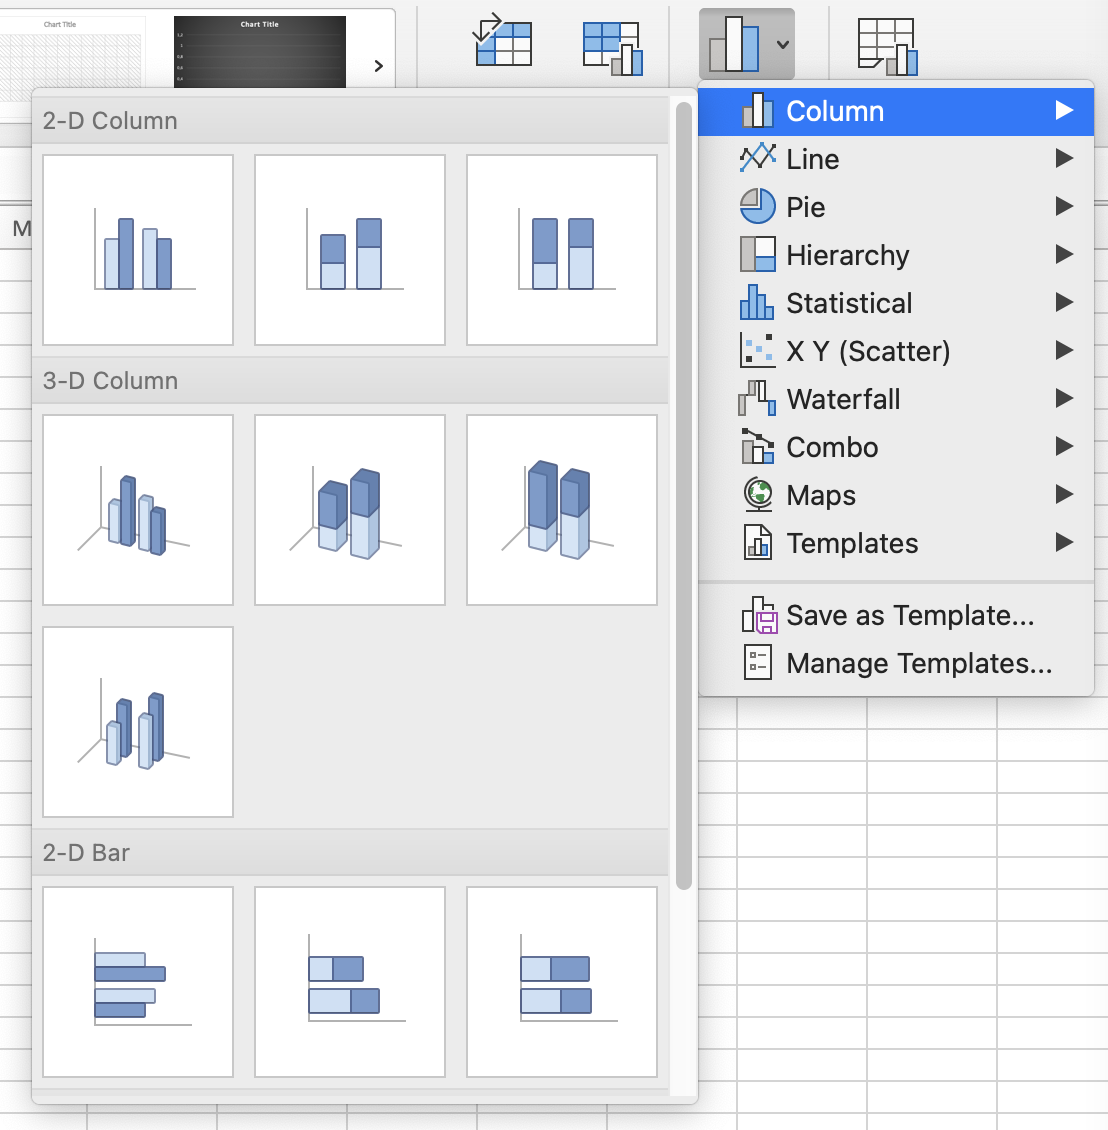
Visualisation tools that are not based on the Grammar of Graphics work with chart type templates. If you want to make a bar chart, for example, you navigate to the chart template gallery, pick the bar chart template, and then input your data into the template.

Picking a chart template from the chart template gallery in Microsoft Excel. Source: Maarten Lambrechts CC BY SA 4.0
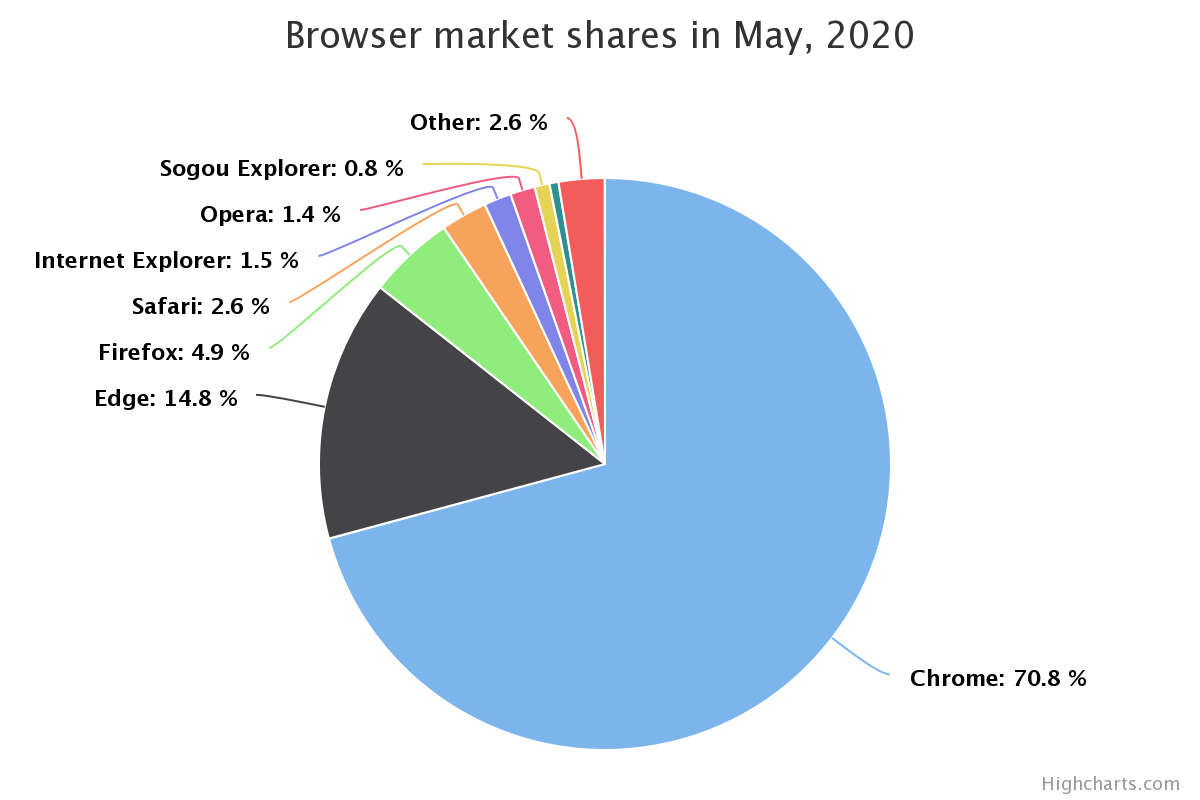
Similarly, in visualisation libraries that are not based on the Grammar, you have to specify the chart type, input the data into the chart and configure it. For example, the following snippet generates a pie chart with the Highcharts JavaScript visualisation library.
Highcharts.chart('container', {
    chart: {
        type: 'pie'
    },
    title: {
        text: 'Browser market shares in May, 2020'
    },
    plotOptions: {
        pie: {
            dataLabels: {
                enabled: true,
                format: '<b>{point.name}</b>: {point.percentage:.1f} %'
            }
        }
    },
    series: [{
        name: 'Brands',
        colorByPoint: true,
        data: [{
            name: 'Chrome',
            y: 70.67
        }, {
            name: 'Edge',
            y: 14.77
        },  {
            name: 'Firefox',
            y: 4.86
        }, {
            name: 'Safari',
            y: 2.63
        }, {
            name: 'Internet Explorer',
            y: 1.53
        },  {
            name: 'Opera',
            y: 1.40
        }, {
            name: 'Sogou Explorer',
            y: 0.84
        }, {
            name: 'QQ',
            y: 0.51
        }, {
            name: 'Other',
            y: 2.6
        }]
    }]
});
Source: www.highcharts.com/demo/pie-basic
This non-Grammar of Graphics approach for data visualisation has two main drawbacks. This is what Leland Wilkinson, author of the Grammar of Graphics (see Foundation of the Grammar of Graphics), has to say about that:
If we endeavor to develop a charting instead of a graphing program, we will accomplish two things. First, we inevitably will offer fewer charts than people want.
If your visualisation tool of choice does not offer the chart type you want to use, you are stuck. You will be forced to look for another tool, and learn how to use that tool if you want to make that other kind of chart. Without a doubt, the most common request to creators and developers of visualisation tools is “When are you going to add chart type X to your chart template gallery?”
But Wilkinson continues:
Second, our package will have no deep structure. Our computer program will be unnecessarily complex, because we will fail to reuse objects or routines that function similarly in different charts. And we will have no way to add new charts to our system without generating complex new code. Elegant design requires us to think about a theory of graphics, not charts.
Here, Wilkinson is saying that without a deeper understanding of how charts are constructed, every new kind of chart that is added to a tool will require a lot of new code to be developed. The Grammar of Graphics solves this problem by creating a framework, with geometric objects, aesthetics and scales, that can be reused and combined to generate more chart types than most non-Grammar visualisation tools offer in their chart template gallery.
This is illustrated by the examples gallery of Vega-Lite. This gallery contains almost 200 different charts, all produced with the same, single, Grammar of Graphics-based tool.
