1-dimensional geometries connect dots to form lines.
The simplest 1-dimensional geometries are vertical and horizontal lines. They only require you to specify at what value they should intersect with the x axis for vertical lines, or the y axis for horizontal lines.
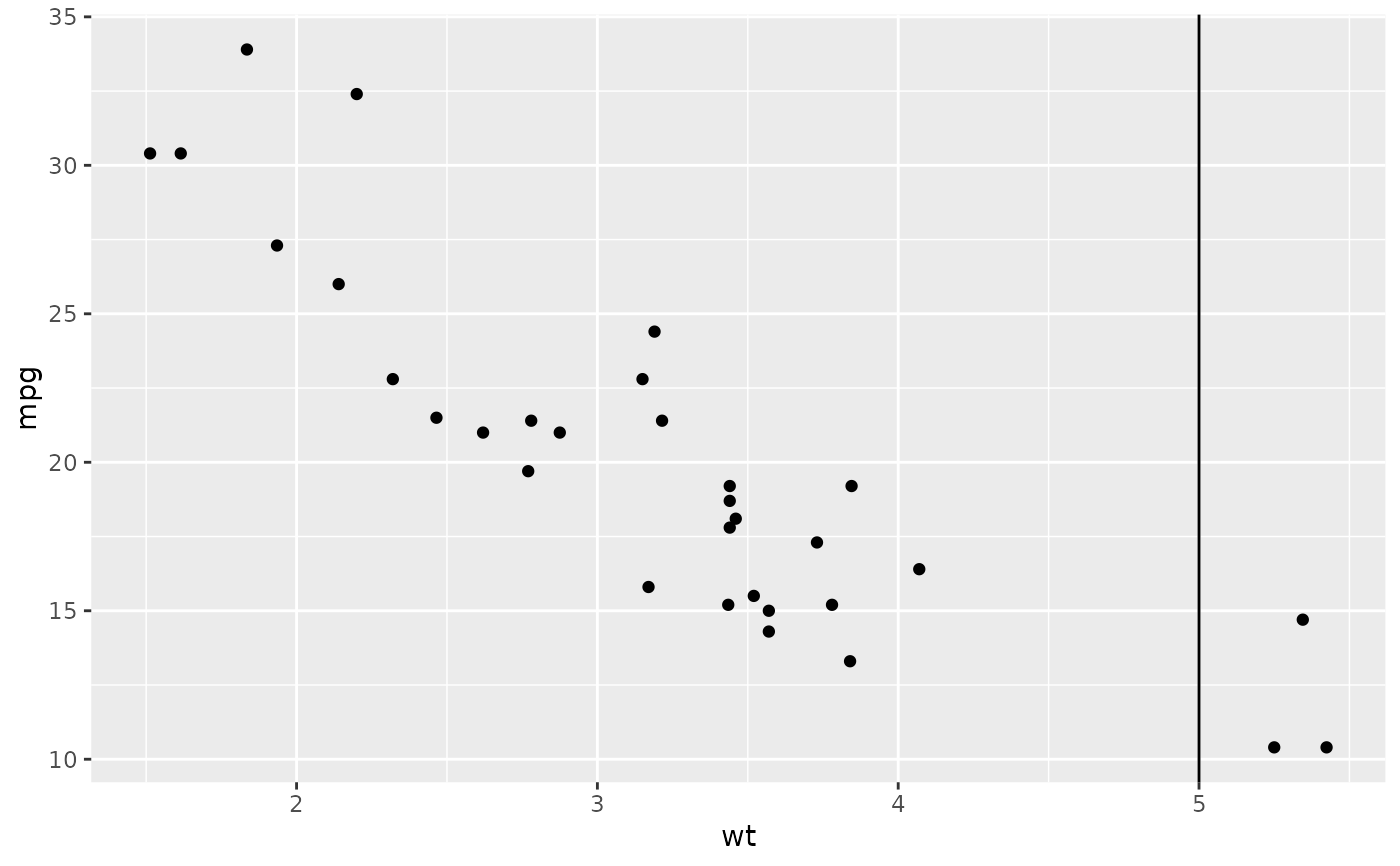
Example of a vline geometry producing a vertical line that intersects the x axis at the value of 5 on a scatterplot made with ggplot2. Source: ggplot2.tidyverse.org/reference/geom_abline.html
| Implementation | Geometry name | Required aesthetics |
|---|---|---|
| ggplot2 | hline, vline | yintercept, xintercept |
| Vega-Lite | rule | x, y |
| Observable Plot | ruleX, ruleY | x, y |
Other 1-dimensional geometries connect 2 points. These geometries require you to provide the the coordinates of both the start and end points of the lines.
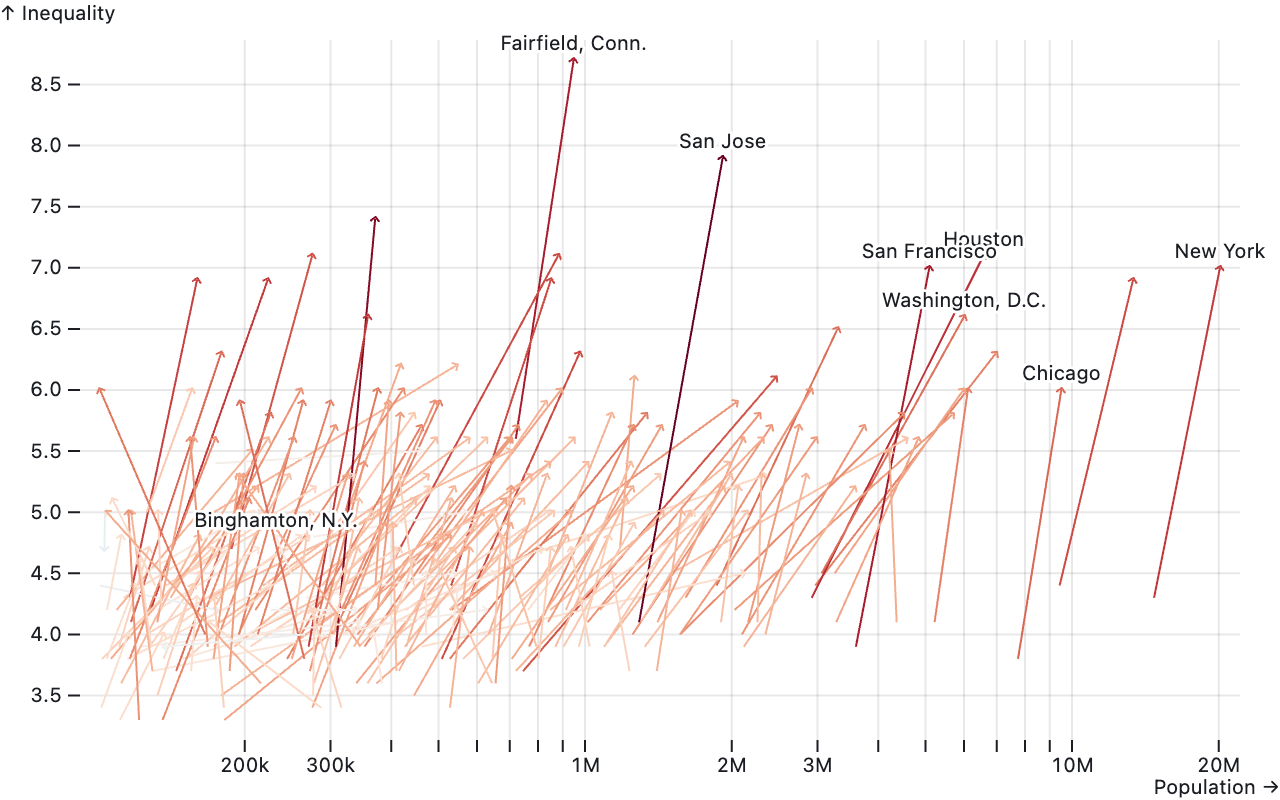
An example of a chart using the link geometry in Observable Plot. It shows the evolution of inequality and population between 1980 (start of the lines) and 2015 (end of the lines, with arrow heads) in the biggest American cities. It also uses a text geometry to label some of the lines. Source: observablehq.com/@observablehq/plot-link
The connection between 2 points can be a straight line, like in the plot above, but it can also be curved.
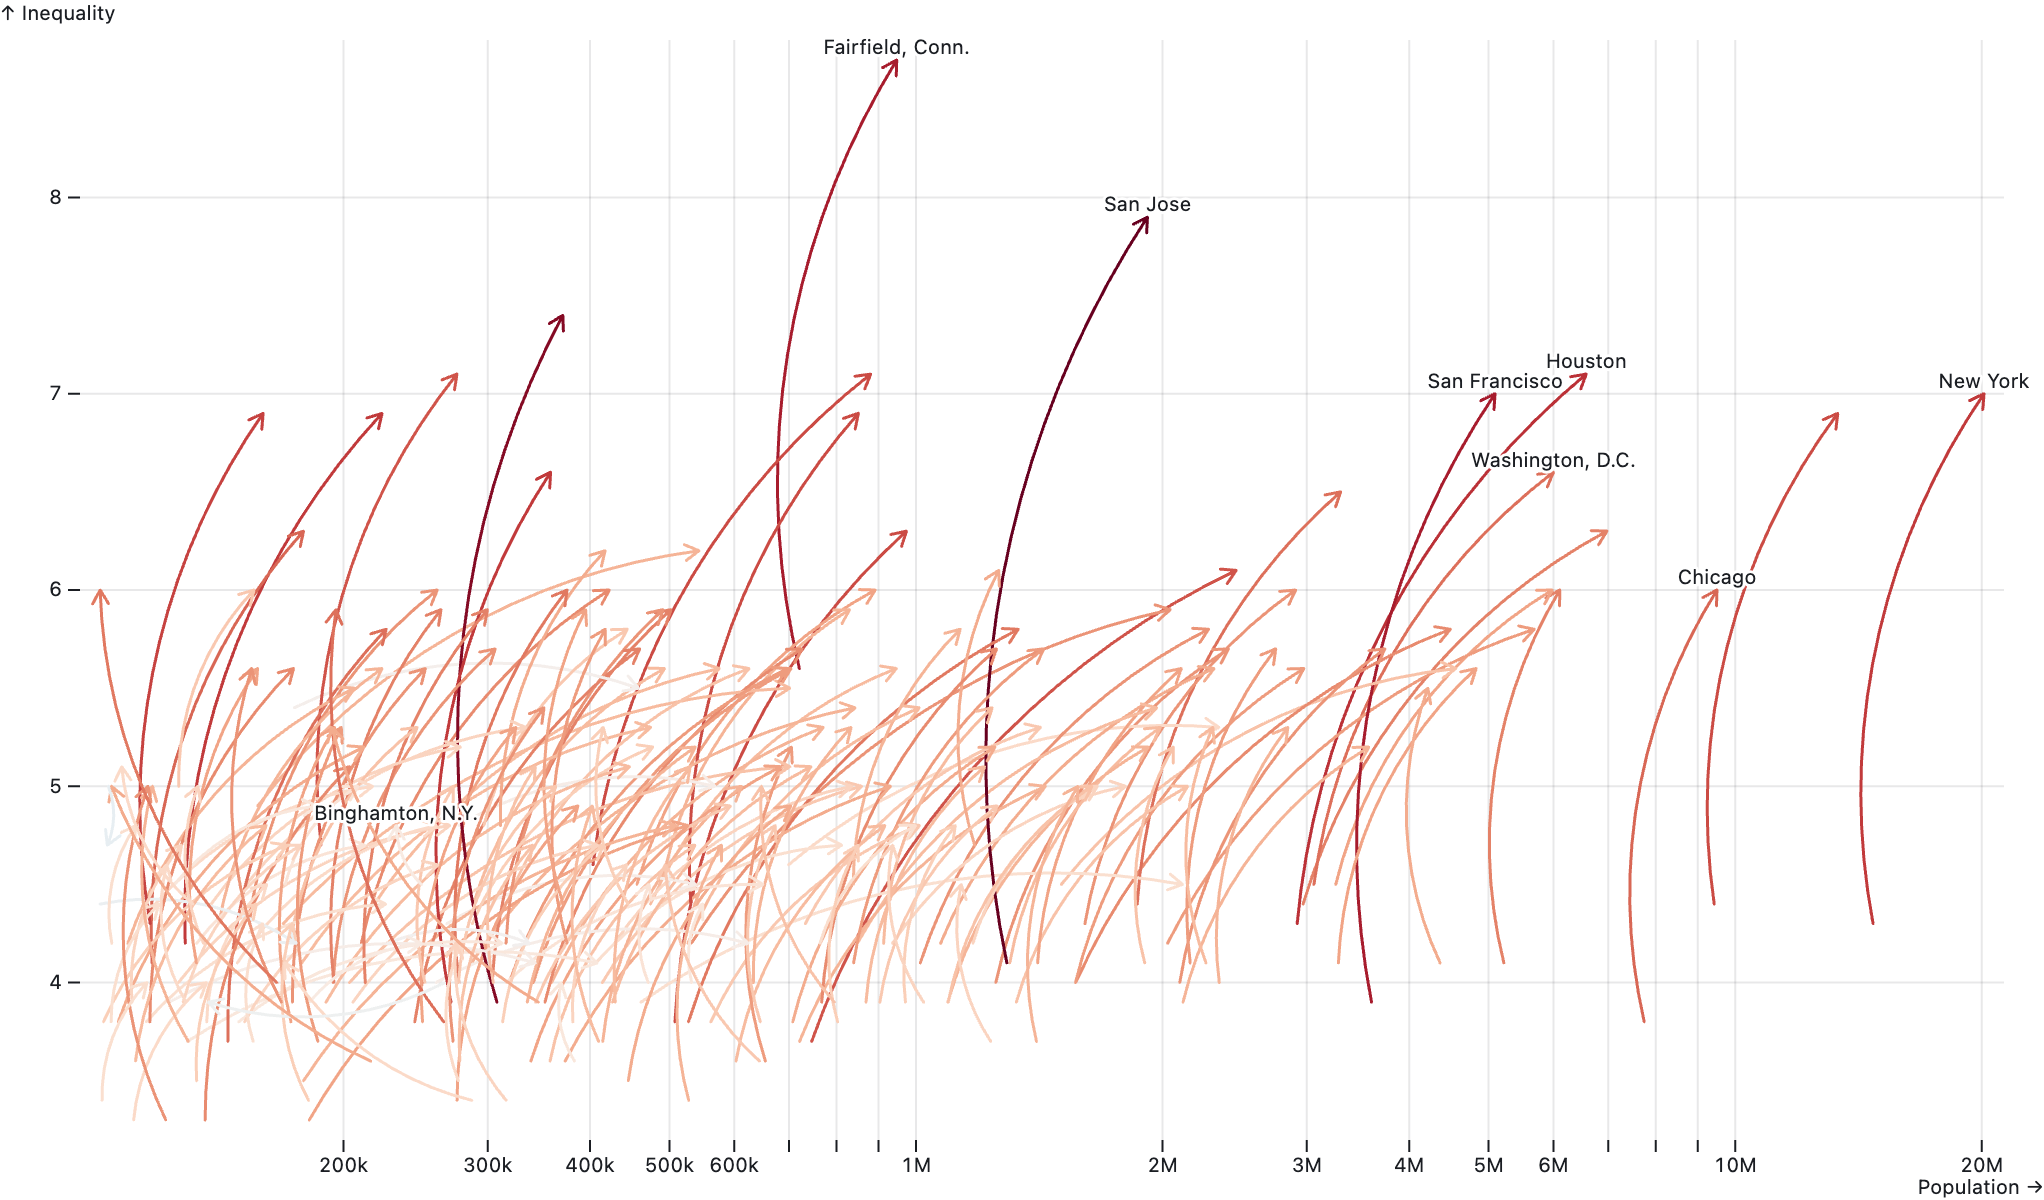
The same plot as above, but using the arrow geometry in Observable Plot instead of the link geometry. The arrow geometry has a bend aesthetic that can be used to make the arrows curved. Source: observablehq.com/@observablehq/plot-arrow
| Implementation | Geometry name | Required aesthetics |
|---|---|---|
| ggplot2 | segment | x, y, xend, yend |
| ggplot2 | curve | x, y, xend, yend, curvature |
| Vega-Lite | rule | x, y, x2, y2 |
| Observable Plot | link | x1, y1, x2, y2 |
| Observable Plot | arrow | x1, y1, x2, y2, bend |
The last type of 1-dimensional geometries connect multiple points. In many cases these geometries will use a time variable for the x aesthetic to produce visualisations of time series. When multiple series are plotted, an aesthetic is needed to specify which points in the data should be connected each other.
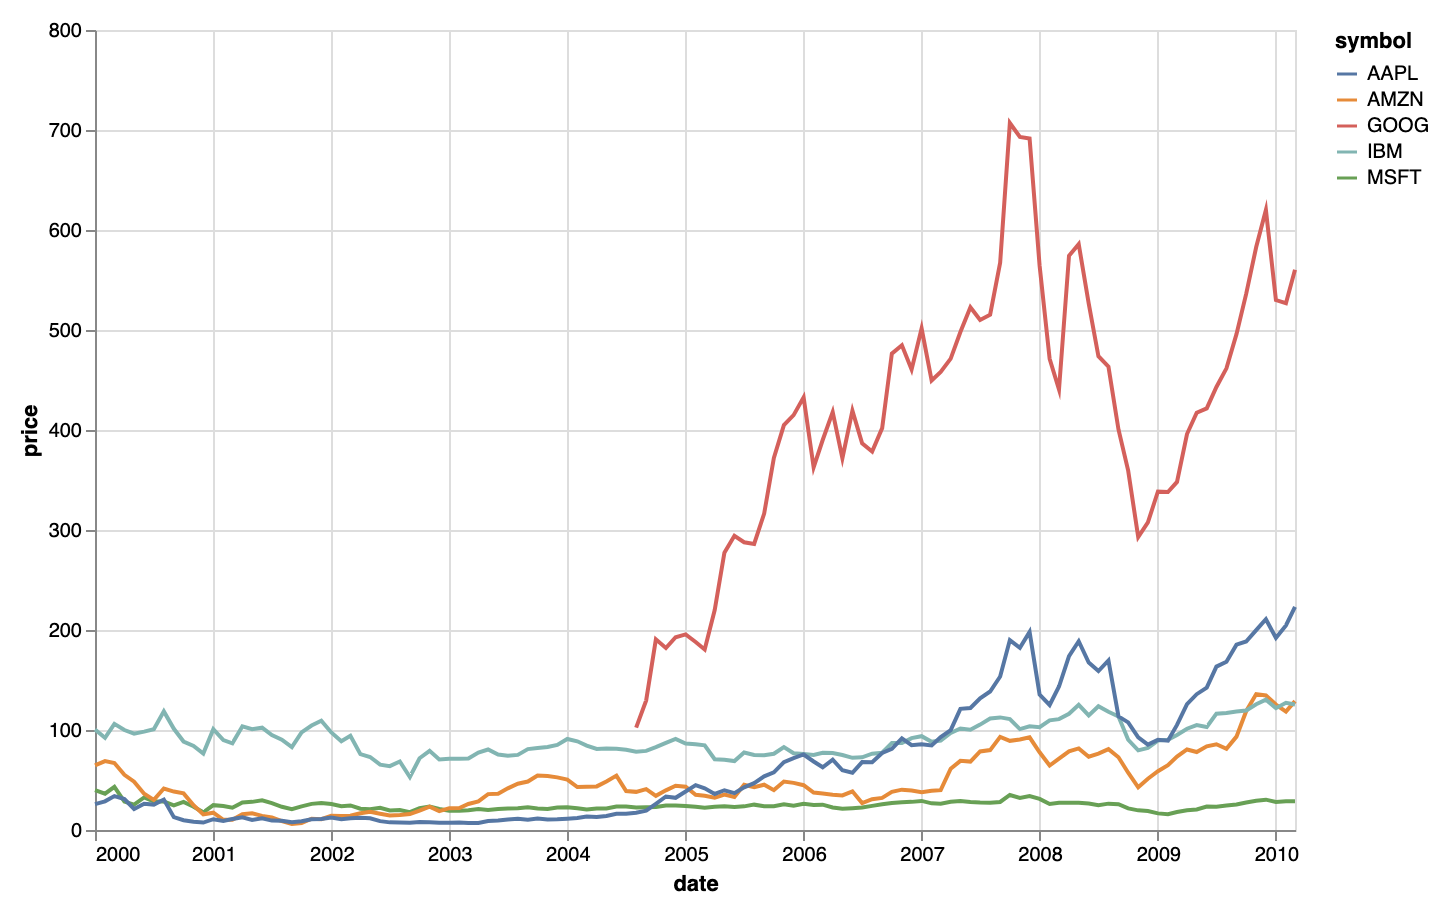
Time series visualised with the line geometry of Vega-Lite. Source: vega.github.io/vega-lite/examples/line_color.html
The plot above uses a linear interpolation between the points in the data, which means that points are connected with straight line segments. Other interpolations are possible, to produce curved or stepped lines.
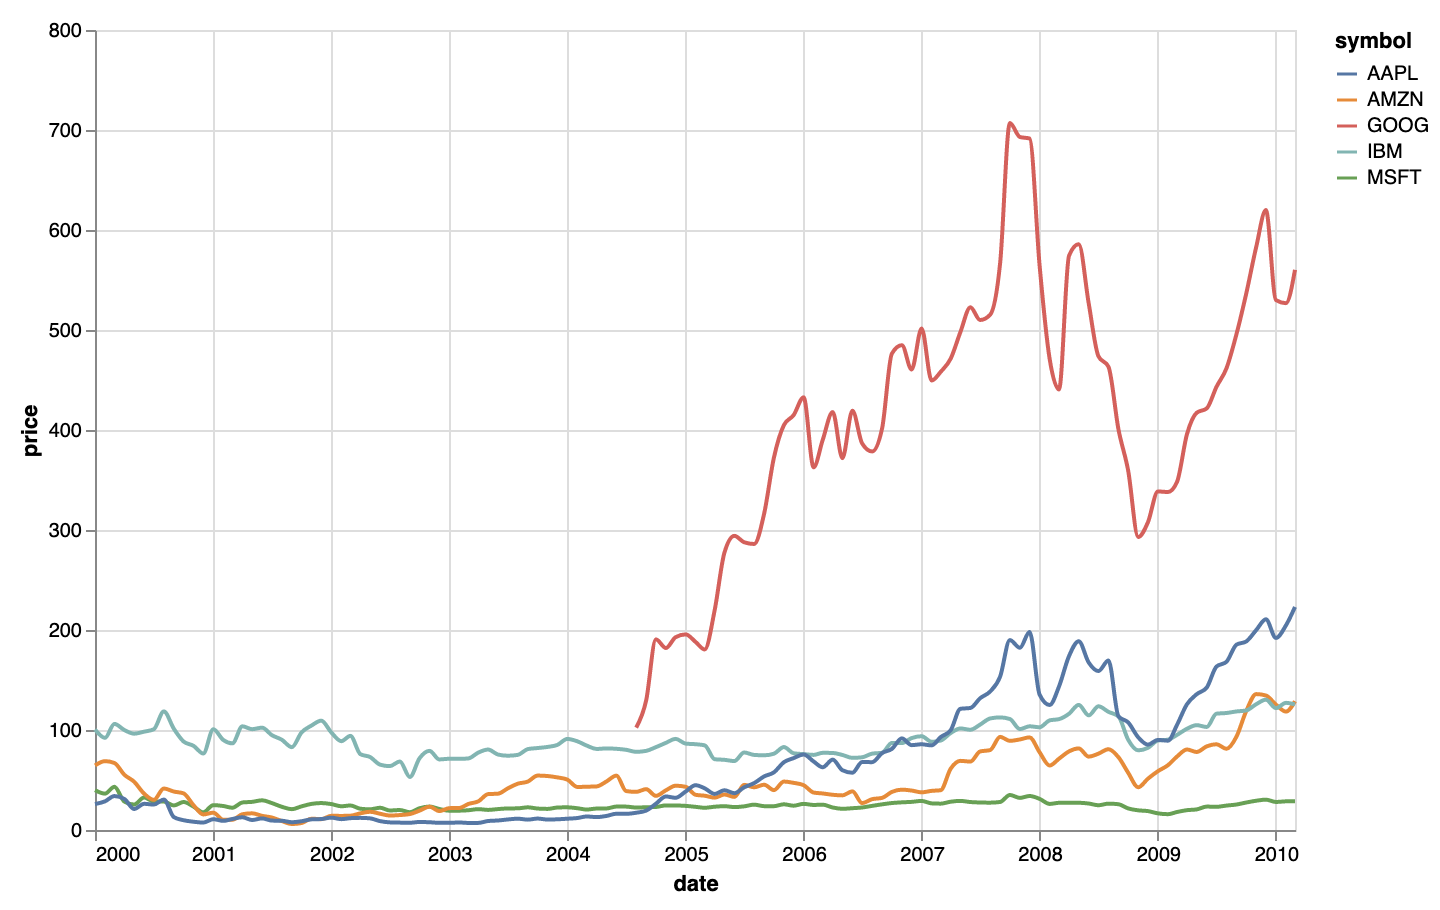
The same plot as above, but with curved line segments between data points. Source: adapted from vega.github.io/vega-lite/examples/line_color.html
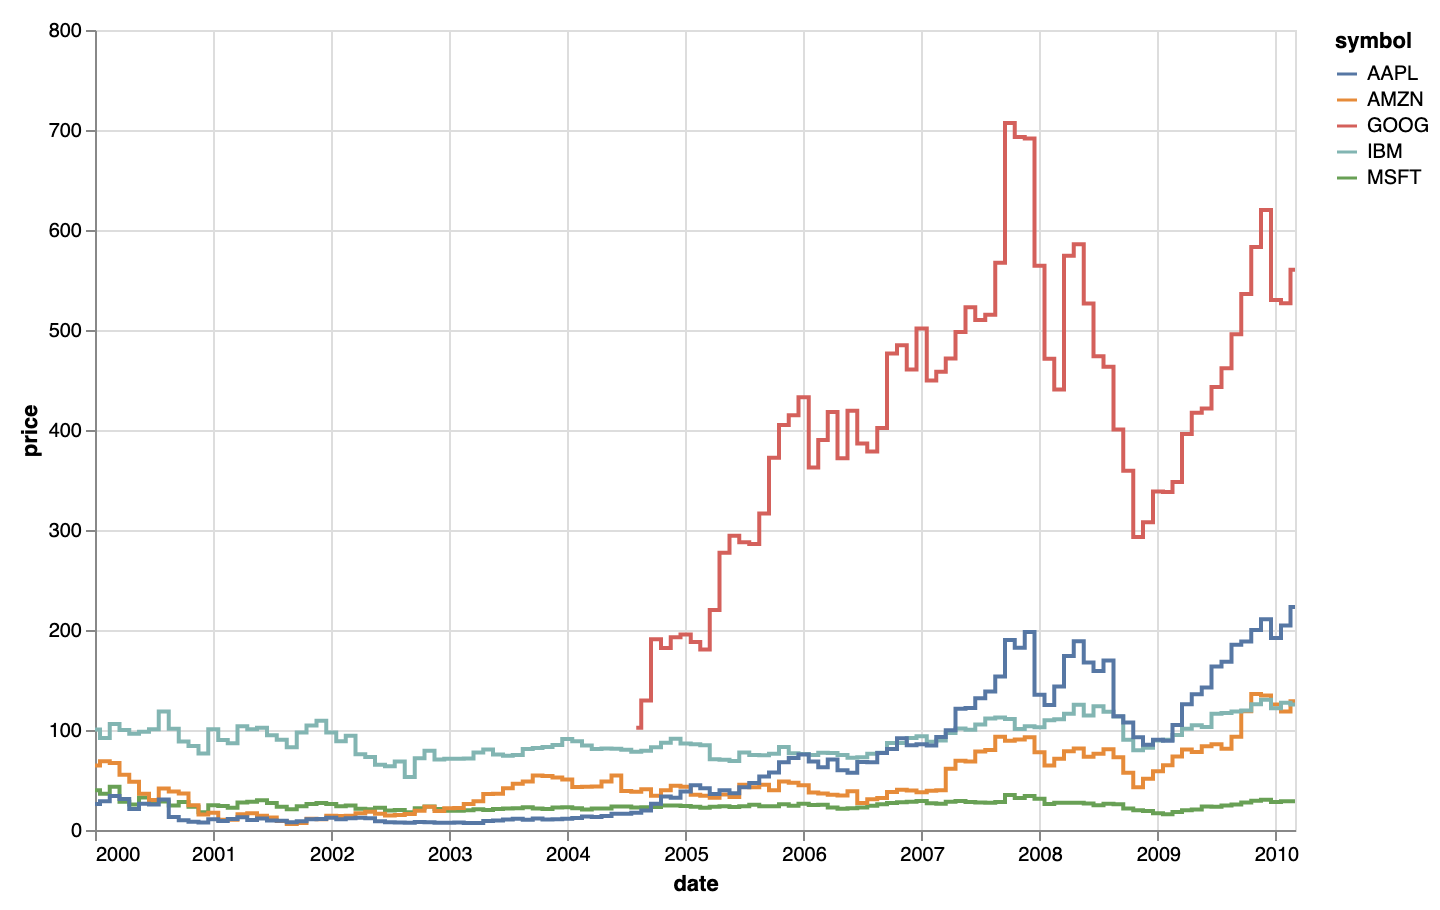
The same plot as above, but with stepped line segments between data points. Source: adapted from vega.github.io/vega-lite/examples/line_color.html
Another parameter that should be specified is the order in which the data points need to be connected. In traditional time series visualisations, with time plotted on the x axis, the order is usually specified by the values on the x axis, so points are connected chronologically.
But time does not have to necessarily be plotted on the x axis. When 2 other variables are used for x and y, the time variable can be used to determine the order in which data points should be connected. This produces a chart type called connected scatterplot.
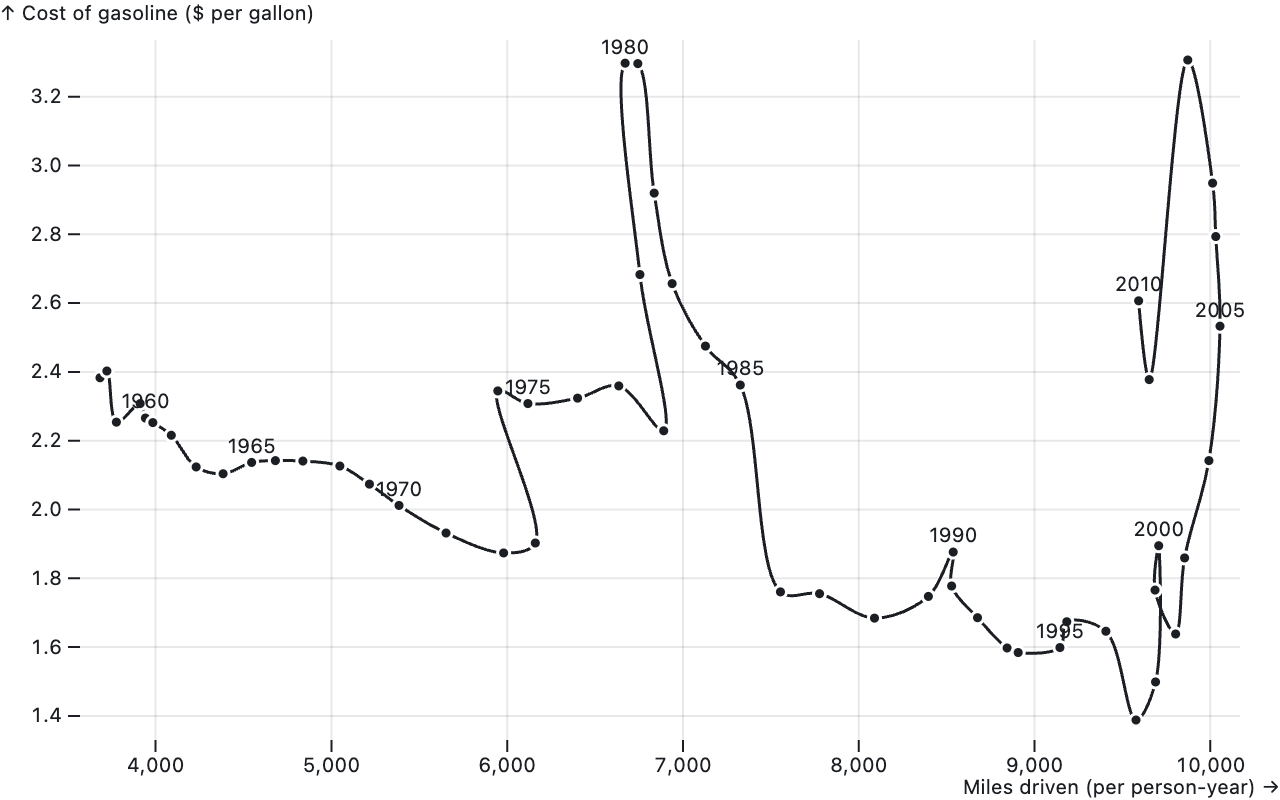
A connected scatter plot of the cost of gasoline versus the average distance driven in a year. Source: observablehq.com/@observablehq/plot-line
Finally, Vega-Lite has the special trail geometry. It is very similar to the line geometry, but has an additional width aesthetic to map data to the width of the segments of the line.
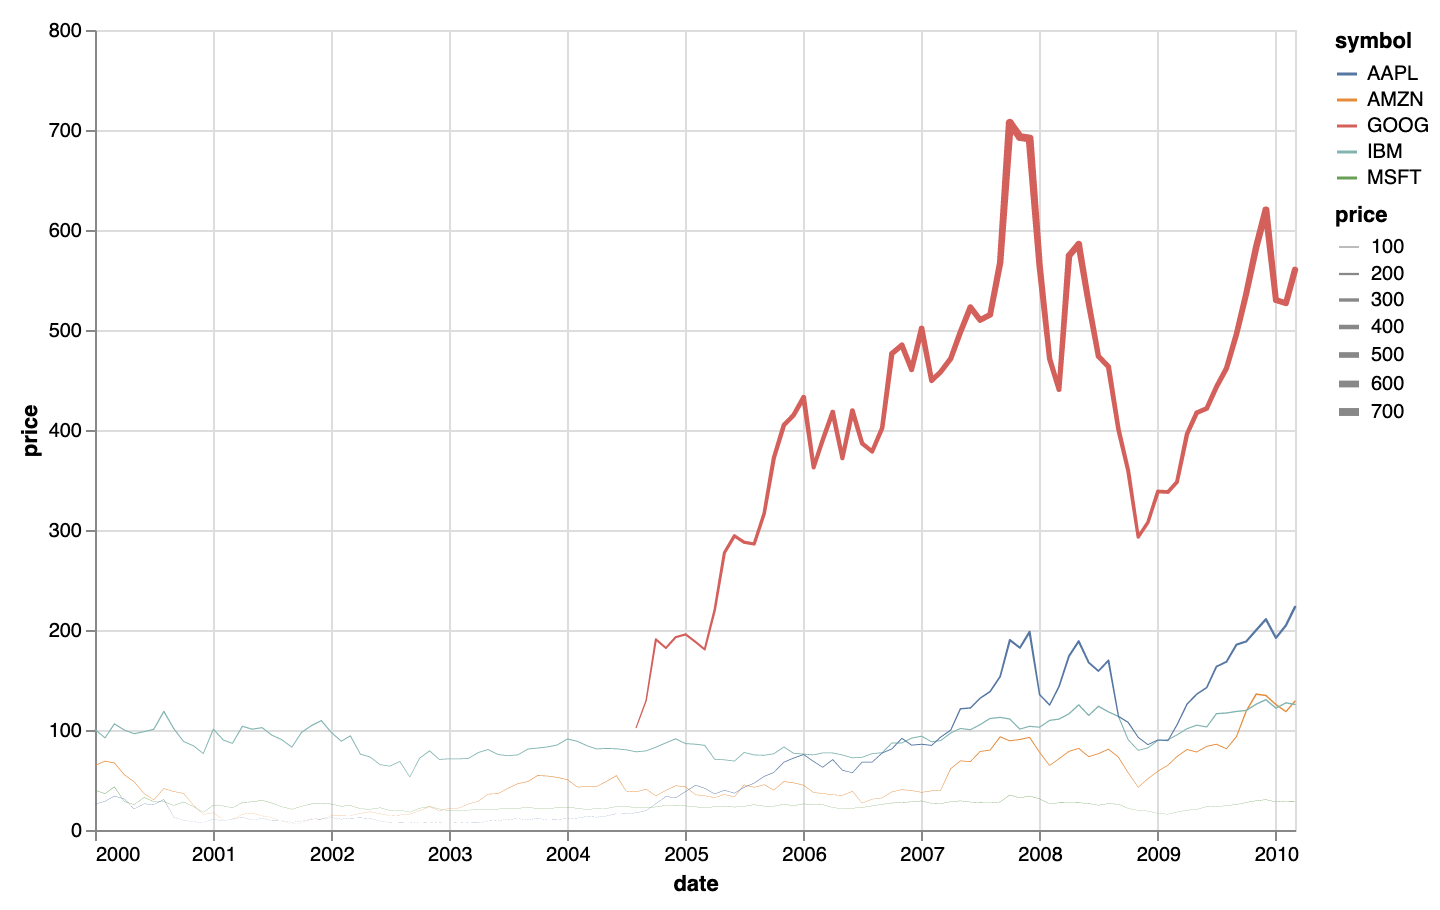
Example of the trail geometry in Vega-Lite. Source: vega.github.io/vega-lite/examples/trail_color.html
| Implementation | Geometry name | Required aesthetics | Additional aesthetics |
|---|---|---|---|
| ggplot2 | path (connects observations in the order in the data) | x, y | group or colour (to group observations in multi-series charts) |
| ggplot2 | line (connects observations in the order of the variable on the x axis) | x, y | group or colour |
| ggplot2 | step | x, y | group or colour |
| Vega-Lite | line | x, y | color (to group observations in multi-line line charts) |
| interpolation | |||
| Vega-Lite | trail | x, y, width | color (to group observations in multi-line line charts) |
| Observable Plot | line | x, y | z (to group observations in multi-series charts) |
| curve |