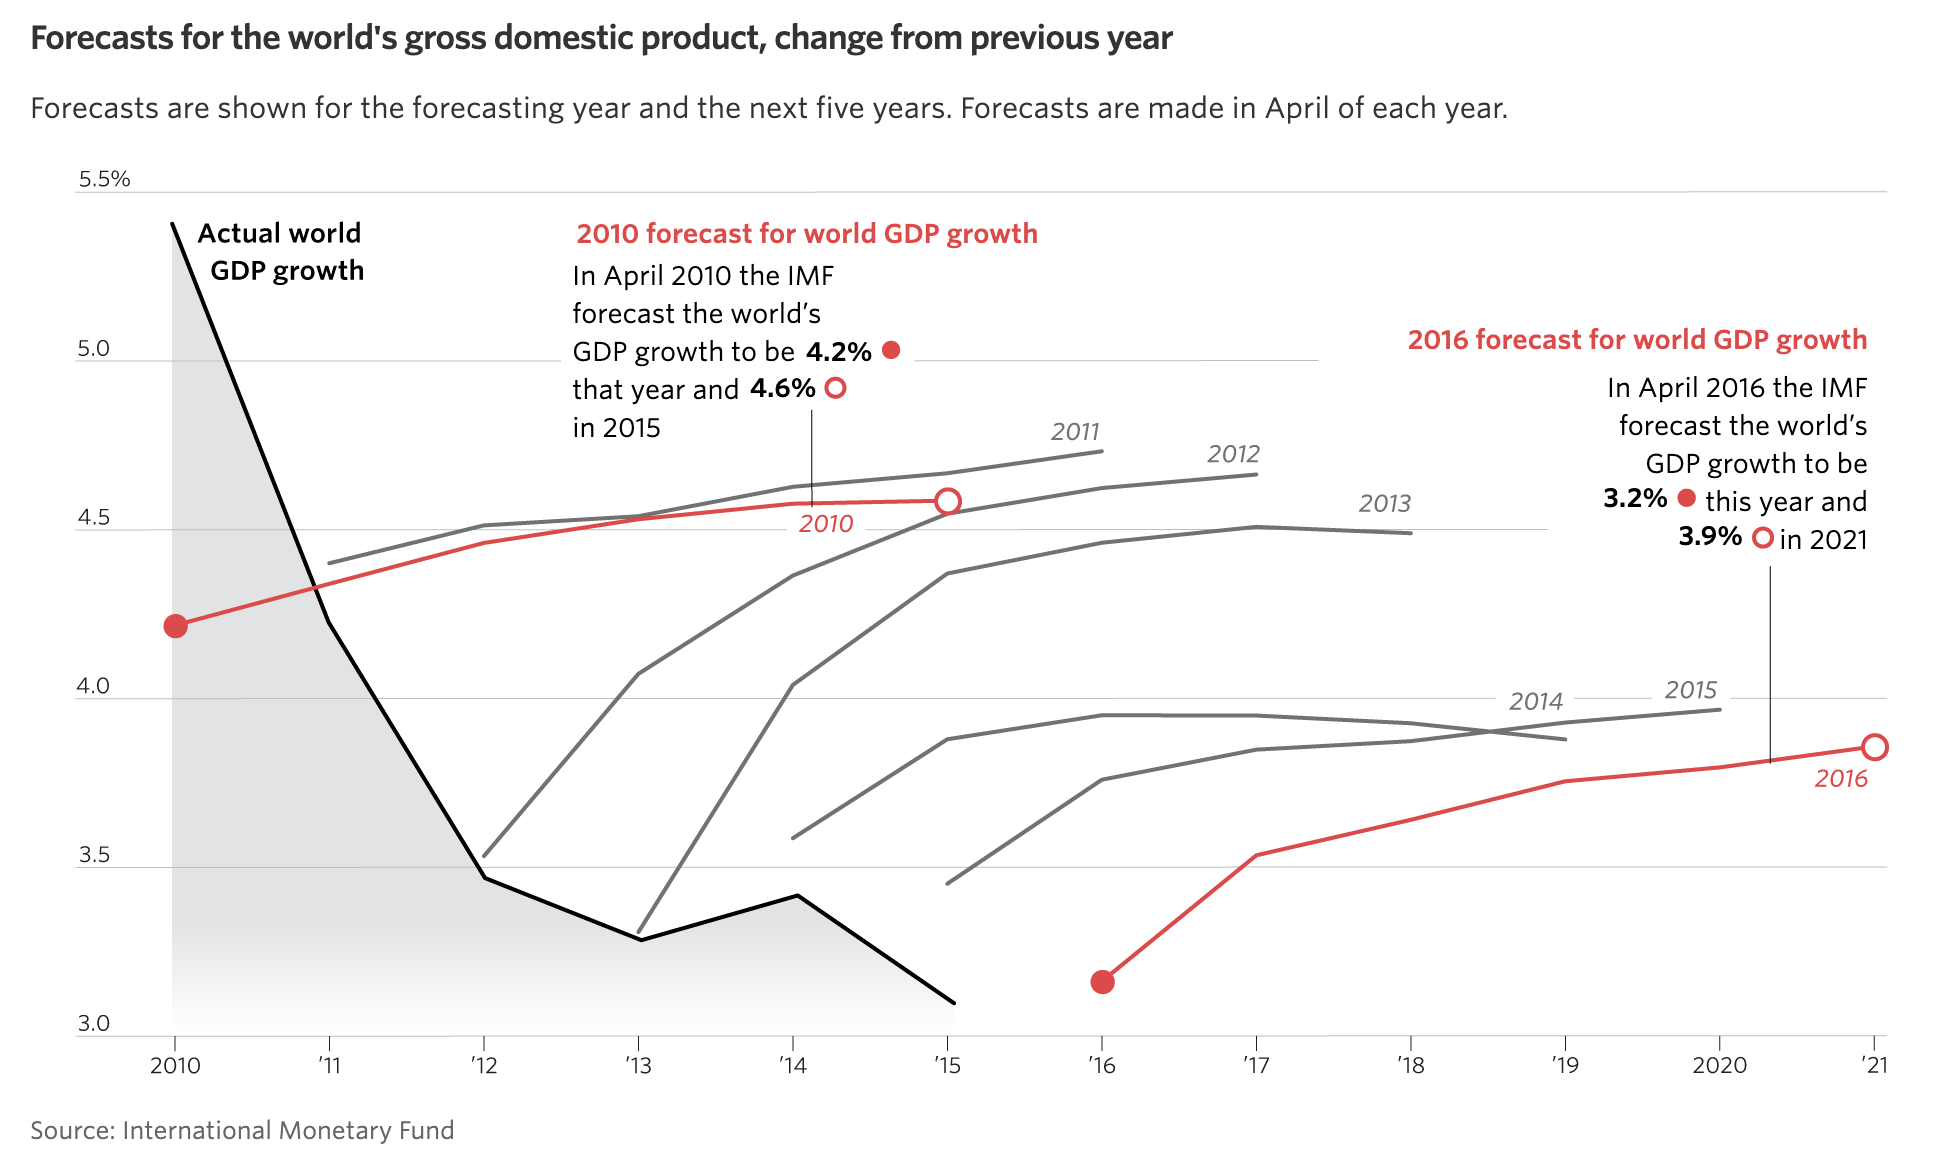
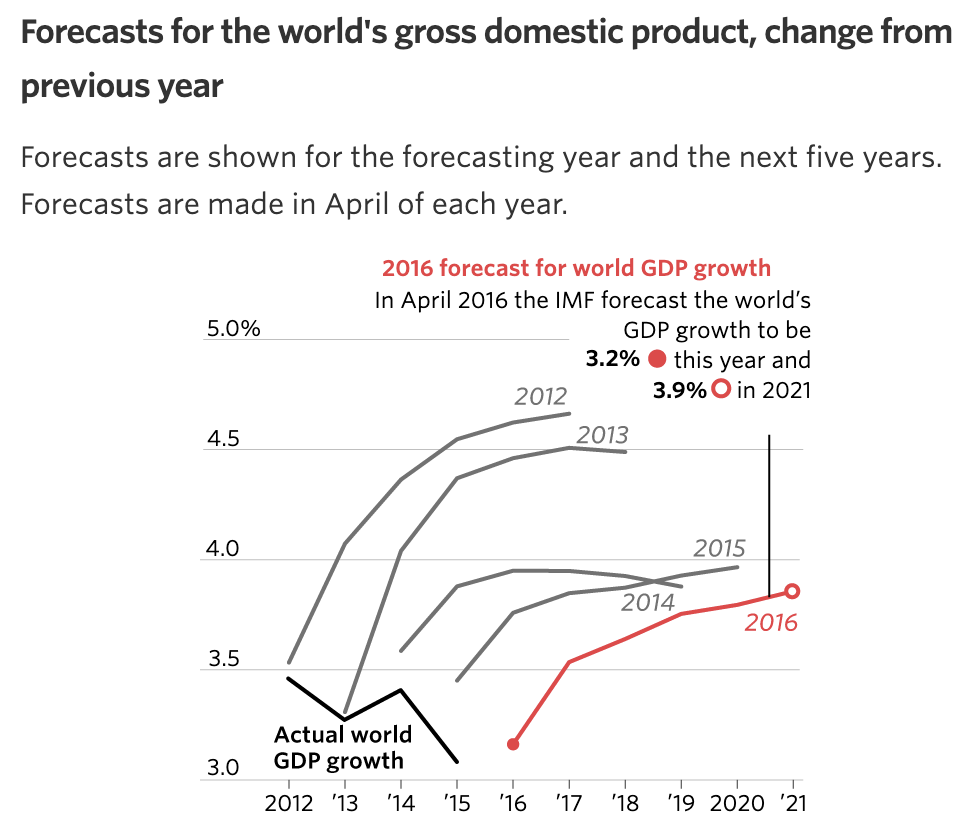
Simplifying a visualisation can also be done by leaving out data points through filtering or sampling. In the example below, the 2010 forecast for world GDP growth is left out of the visualisation on smaller screens.

Source: wsj.com

Source: wsj.com
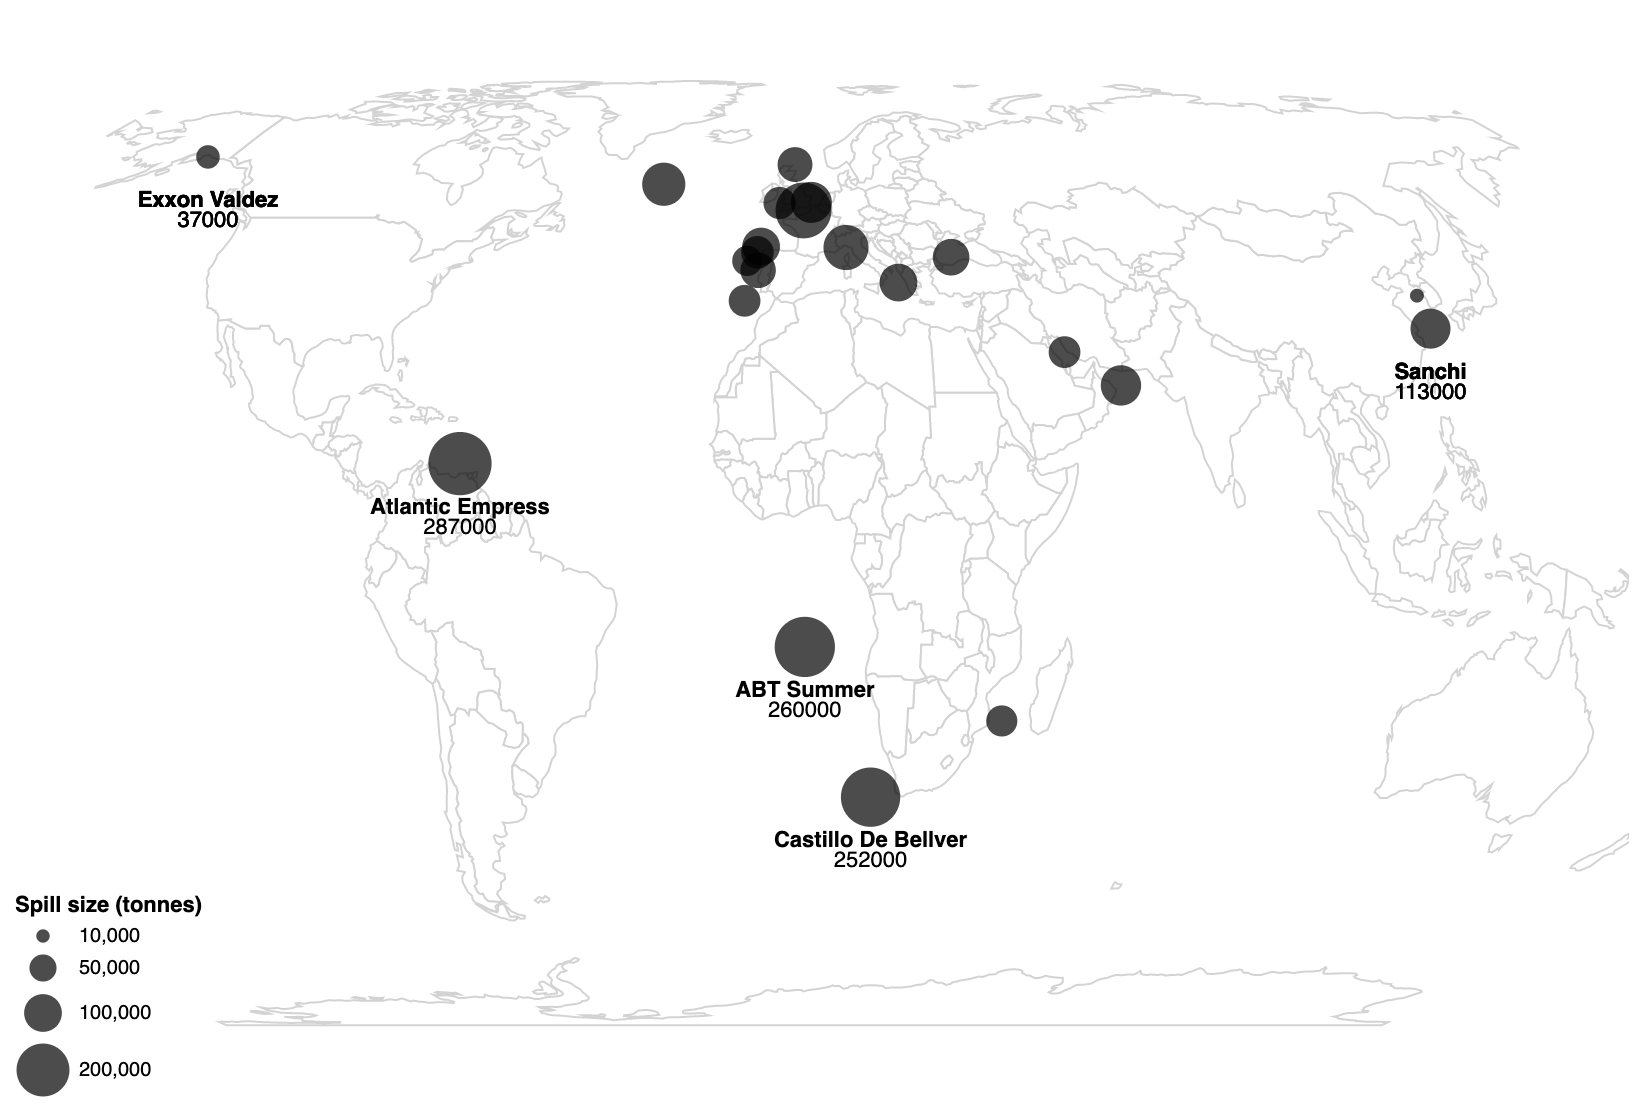
The map below shows the 20 biggest oil spills in 2018, with the size of the dots scaled to the size of the spill, and the most relevant ones labelled.

Source: Techniques for Flexible Responsive Visualization Design, Hoffswell et al
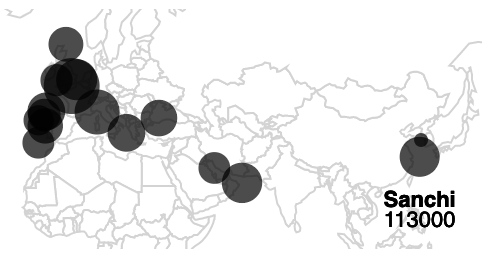
For a thumbnail version of this map, some smaller oil spills can be filtered out. In this way, the map can be zoomed in, and exclude parts of the world that are less relevant for the story the map is trying to convey. Notice that the number of labels is also reduced, and the bubble size legend is removed.

Source: Techniques for Flexible Responsive Visualization Design, Hoffswell et al