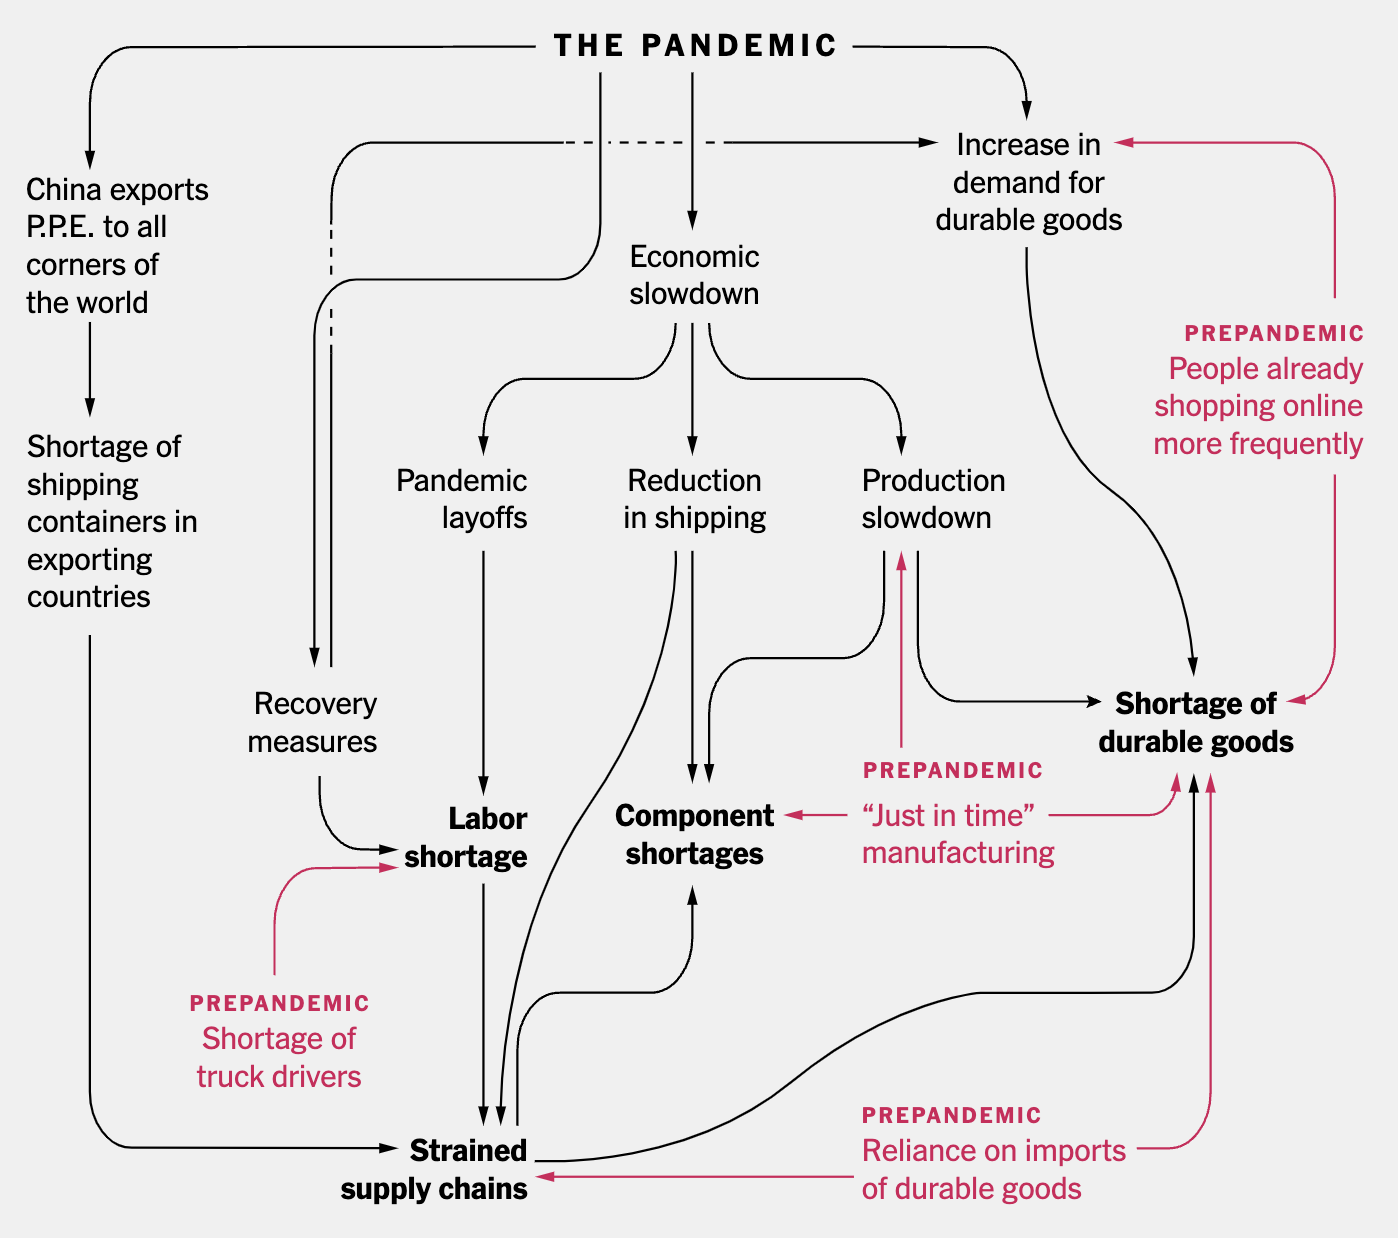
Source: A small illustration showing a drawing with a lot of different arrows
Flow charts visualise processes, sequences of events and relationships between features. They might not be driven by (numerical) data, but they can tell stories that are hard to tell using only text in a visual way.

Source: How the Supply Chain Crisis Unfolded, nytimes.com